비트코인 청산 히트맵이란 무엇인가요?
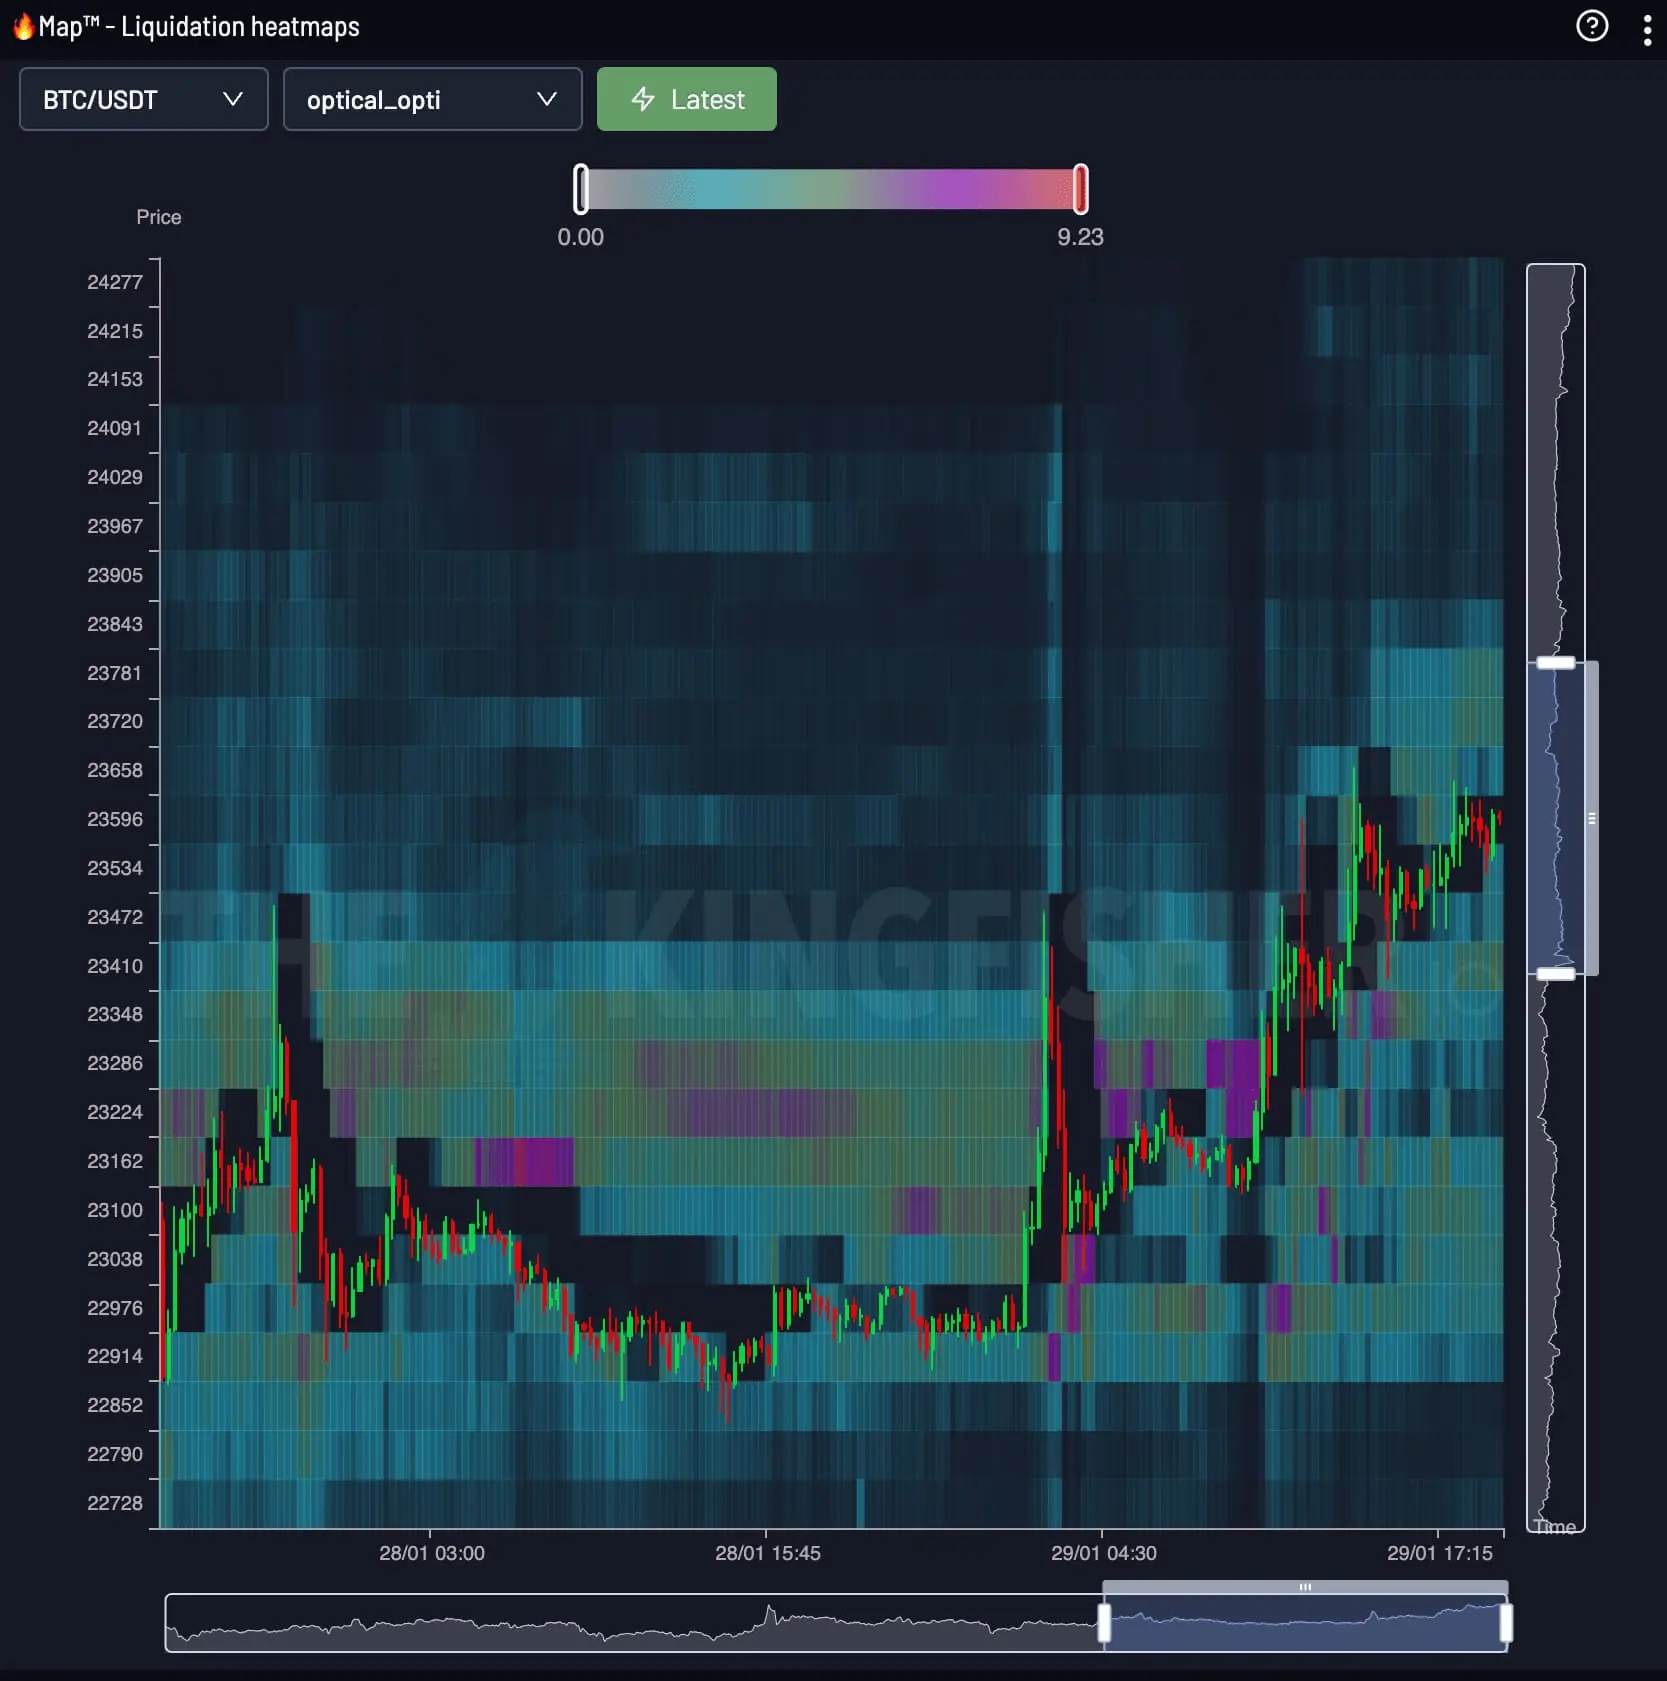
청산 히트맵은 세로축에 가격, 가로축에 시간을 표시합니다.


Heatmap · IMX / USDT
Immutable X (IMX) Real-Time Liquidation Clusters
가격과 시간에 따라 청산 압력을 추적하고 레버리지 포지션이 형성되고 이동하고 해소되는 흐름을 확인하세요.
Price × Time
The Kingfisher Heatmap은 연속된 LiqMap 데이터를 하나의 지속적인 화면으로 연결합니다. 색상 강도로 주요 구간과 변화를 빠르게 읽을 수 있습니다.
청산 히트맵은 세로축에 가격, 가로축에 시간을 표시합니다.
현재 가격에서 시작해 위아래의 가장 밝은 밴드를 비교하고, 시간에 따라 압력이 커지는지 약해지는지 확인하세요.
밝고 오래 유지되는 밴드는 청산 압력이 집중된 구간을 보여줍니다. 밴드가 흐려지거나 사라지면 압력이 약해지거나 해소된 것입니다.
IMX / USDT
The brightest bands on the IMX map mark the price levels holding the most modeled liquidation risk, right now. Price gravitates toward these bands because forced orders wait inside them.
A stop placed inside a dense cluster gets swept by the wick that clears the band. Place yours beyond the cluster edge and size the position so that distance costs a fixed fraction of the account.
Check the distance from entry to the nearest heavy cluster before choosing leverage. The calculator below converts that distance into a liquidation price for any leverage tier.
LiqMap / Heatmap
LiqMap은 한 시점의 가격 주변 청산 구조를 보여줍니다. Heatmap은 시간축을 더해 구간이 형성되고 이동하고 해소되는 과정을 추적합니다.
| Dimension | IMX Liquidation Map | IMX Liquidity Heatmap |
|---|---|---|
| Shows | Liquidation price levels, tier by tier | Heat intensity of pressure over time |
| Axes | Price x leverage estimate | Price x time (rolling 24h) |
| Answers | Where exact levels and cluster walls sit | When pressure builds toward a level |
| Best use | Placing stops and entries | Timing the test of a level |
Traders read both together: the map gives the level, the heatmap gives the timing. Open the IMX liquidation map view for tier-by-tier levels.
Immutable X 청산맵Enter your entry price, leverage and side. The calculator returns your exact IMX liquidation price and position size before you commit margin.
Open the full IMX calculatorThe Kingfisher Terminal
청산 물량은 자석처럼 작용합니다. 가격이 두꺼운 청산 클러스터 쪽으로 끌려갔다가 청산이 터지며 변동성이 커지는 경우가 많습니다. 청산맵은 확률 도구이지 가격 보장이 아닙니다.
FAQ
비트코인 청산 히트맵에 대해 알아야 할 모든 것
세로축은 가격, 가로축은 시간입니다. 현재가 아래 쌓인 물량은 롱 청산, 위 쌓인 물량은 숏 청산 임계점입니다. 색이 짙은 구간일수록 청산 물량이 두껍고, 가격이 닿으면 폭발적으로 풀립니다.
청산맵은 레버리지별 청산 가격대를 레벨로 보여주고, 청산히트맵은 시간 흐름에 따라 청산 압력이 어디에 쌓이는지 열 분포로 보여줍니다. 레벨 확인은 청산맵, 흐름 확인은 히트맵을 쓰세요.
청산 물량은 자석처럼 작용합니다. 가격이 두꺼운 청산 클러스터 쪽으로 끌려갔다가 청산이 터지며 변동성이 커지는 경우가 많습니다. 청산맵은 확률 도구이지 가격 보장이 아닙니다.