

It started below the chart.
By 2018, perpetual swaps were scaling faster than much of the infrastructure beneath them. BitMEX was a center of gravity for bitcoin derivatives, while matching engines, risk systems and index construction were being stress-tested in public.
A matching engine has finite throughput. Every message passes through gateways, queues, risk checks, matching and market-data publication. Under load, the difference between the market a trader sees and the market that can actually execute becomes part of the risk.
At the same time, enormous derivatives exposure could be marked from a much smaller and fragmented spot market. The imbalance is even sharper in thin altcoins: concentrated supply, shallow index constituents and extreme leverage can turn modest real flow into a violent perpetual move.
Our desk was running cross-venue arbitrage and high-frequency quoting across BitMEX and Deribit. At peak, our systems generated up to 20,000 quote updates per minute. Watching the tape at that intensity made venue latency, risk controls, market-quality constraints and execution weaknesses impossible to treat as abstractions.
We built our own order-book watchers, trade listeners, indices and market-quality trackers. The tape became the ground truth: not a story about what price had done, but evidence of how pressure moved between spot, perpetuals and competing venues.
The market is not only buyers and sellers. Some participants have no choice.
A leveraged position approaches liquidation when the venue’s mark price breaches the applicable maintenance-margin threshold. The trader loses discretion, and the venue’s risk machinery attempts to reduce or close the position according to its published rules.
Leverage accumulates
Open interest grows while collateral and available liquidity do not necessarily grow with it.
The mark price moves
The venue’s mark follows its published methodology—often an index adjusted by a fair-price or funding basis—not the last candle alone.
Maintenance margin breaks
Once the mark crosses a position’s maintenance threshold, discretion ends and the liquidation engine takes over.
Forced orders hit the book
Liquidation engines create forced order flow. When it crosses the spread or chases price, that flow can consume liquidity and trigger the next layer.
The sweep accelerates
Momentum feeds on mechanically forced inventory until the cascade meets enough real opposing liquidity.
The fuel runs out
Around that exhaustion zone, patient terminal liquidity may be paid to take the other side of the sweep.
Liquidation triggers are rule-based. Liquidation maps are probabilistic.
The liquidation engine follows fixed rules. LiqMap estimates where the resulting forced flow may concentrate.
The liquidation engine follows known contract rules. The unknowns include individual entry prices, leverage, collateral, subsequent position changes and the depth available when a trigger is reached. Our model turns those unknowns into a normalized estimate of where forced-flow pressure is concentrated.
We did not model motives. We modeled constraints. Whether a move begins with genuine demand, inventory pressure or abusive flow, the venue’s risk engine still follows its rules.
Find where the sweep needs liquidity—and where its fuel may end.
Most technical indicators repackage past price and volume. We wanted to estimate a mechanism capable of forcing future execution.
Terminal liquidity
When forced orders sweep an extreme, few participants want to take the other side. That is exactly when patient liquidity can become most valuable. Our research estimates the zones where mechanical flow may accelerate, then where remaining liquidatable inventory may run out or meet sufficient opposing depth.
Instead of chasing the wick, the strategy sought to provide terminal liquidity around those exhaustion zones—seeking to be paid for absorbing forced execution and capturing any subsequent mean reversion or volatility expansion.
The formula remains proprietary. Its conceptual boundary does not: open interest, contract mechanics, modeled leverage, position timing, mark-price construction and live liquidity must agree with one another. A liquidation map is a model of pressure—not a decorative replay of past liquidations.
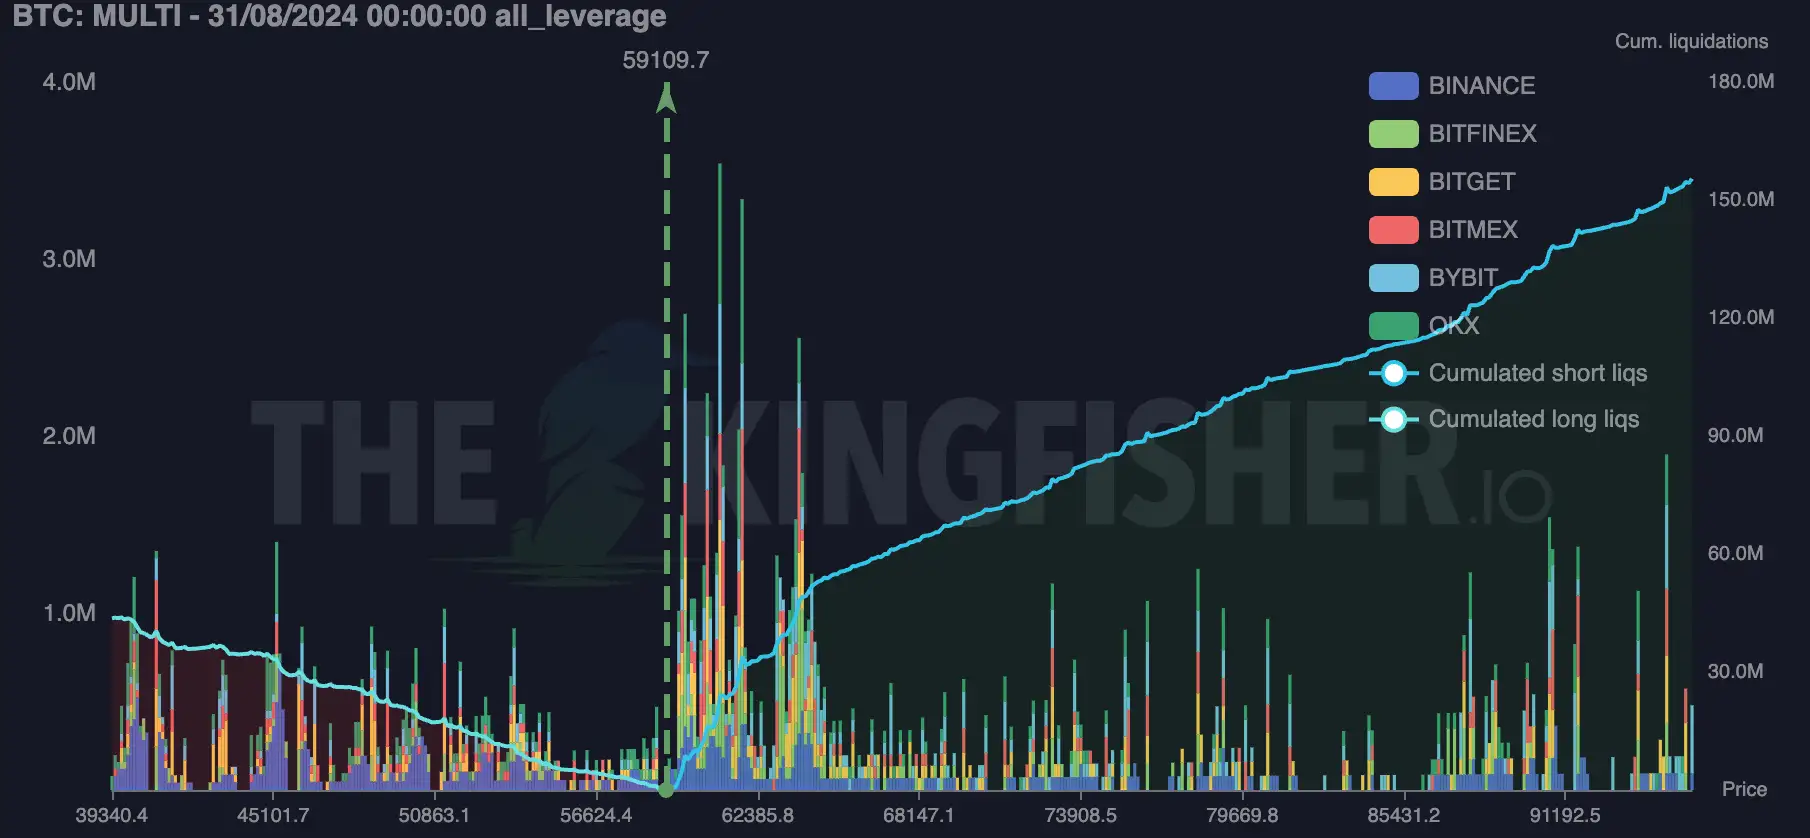
The map, translated into fields you can screen quickly.
KF-Trade classifies liquidation-based model outputs into a direction, predicted target, time horizon, model Z-score and signal strength. In the Signals pane, outputs can be sorted by expiration, Z-score or expected return, filtered by strength, and reviewed as active or expired.
KF-Trade ranks liquidation signals by direction, target, strength and expiry.
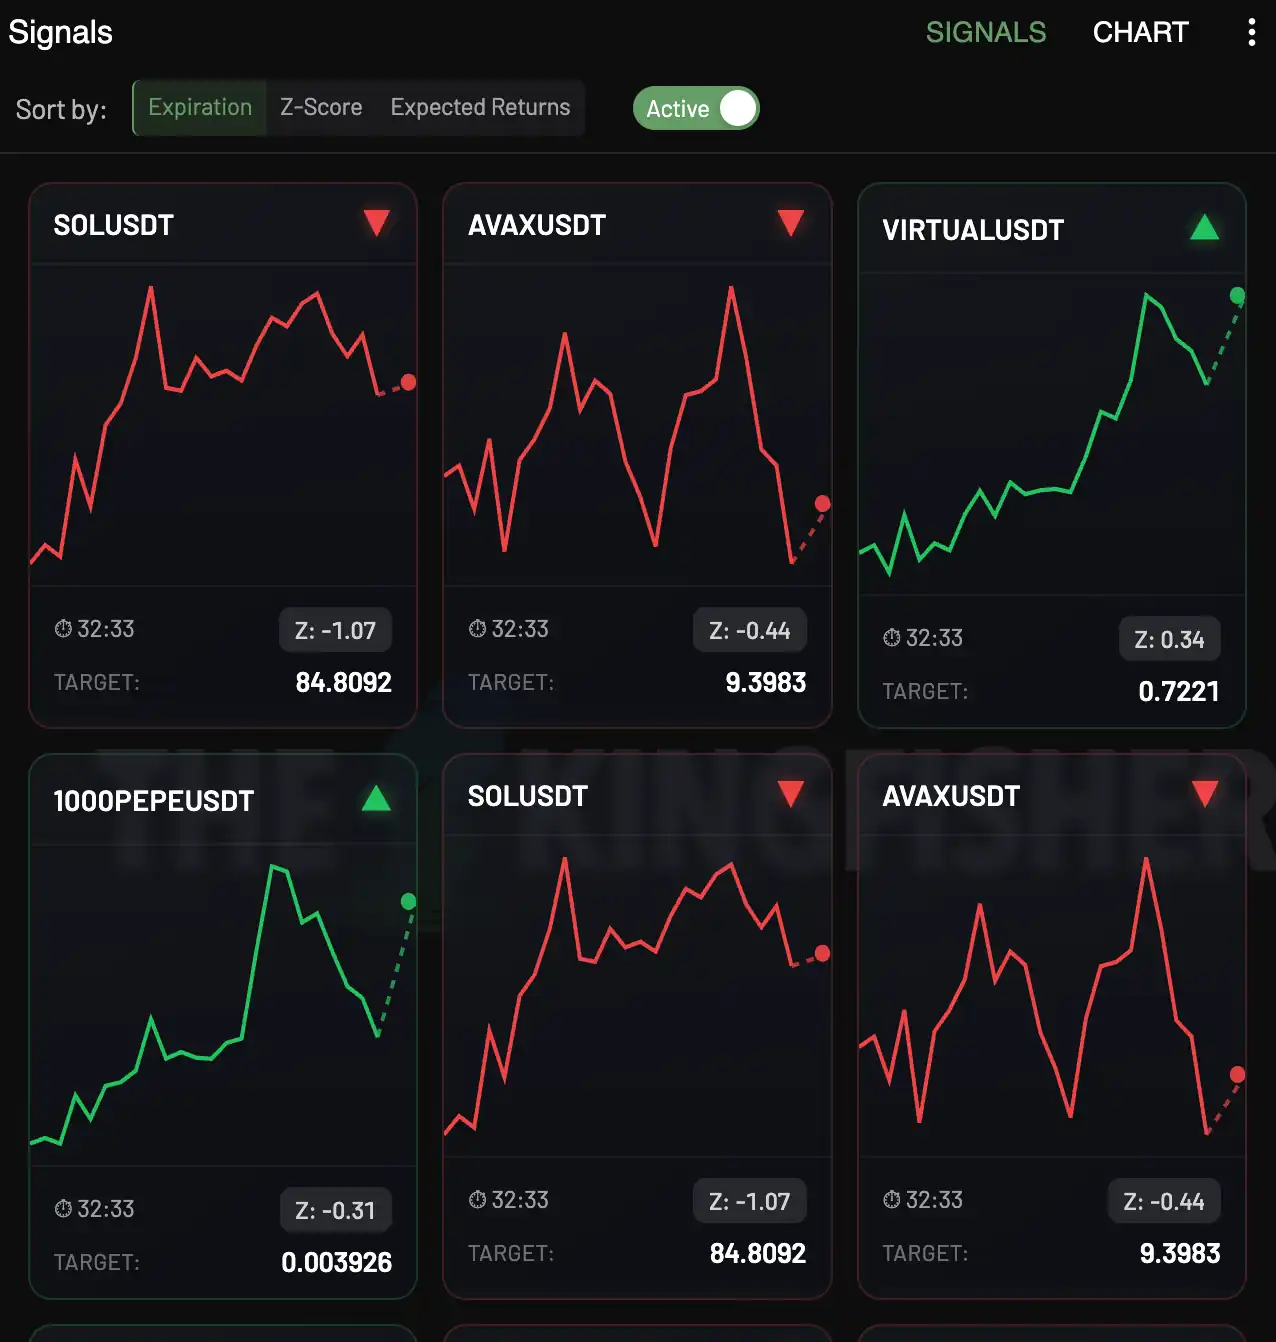
- Direction
- Predicted up or down
- Target
- Predicted price
- Horizon
- Time remaining to expiry
- Strength
- Neutral, Weak or Strong
- Model Z-score
- Shown with each signal
- Chart
- Historical signals over price
We stopped keeping the edge private.
Venue risk made one lesson unavoidable: even a strong strategy can be compromised when the infrastructure, index or counterparty cannot be trusted. We chose to release the map publicly so independent traders could see what was behind the curtain, protect themselves and build their own playbooks. We made the signal and its interpretation accessible while keeping the production formula proprietary.
Early research led into matching engines, index prices and the tape
Research and algorithm development date back as far as 2015. By 2018, we were studying perpetual swaps, matching-engine behavior, index construction, fragmented order books and the tape while trading across venues.
We built our own market monitors
We added order-book listeners, trade capture, internal indices and market-quality tooling.
The map became software
The first LiqMap implementation was completed in July 2020.
The liquidation map became publicly documented
By October 2020, Google had indexed The Kingfisher’s public liquidation-map product.
Public delivery expanded
Public-map delivery expanded in December 2020, making LiqMap available beyond the private trading workflow.
The model expanded beyond liquidations
Research moved into market quality, toxic order flow and options-dealer impact, including gamma and vanna exposure.
KF-Trade Signals, API and MCP expanded access
KF-Trade Signals added predicted direction and target, strength filters, expiry sorting, and historical signal overlays on price charts. The API and MCP server opened Kingfisher datasets to programmatic workflows.
A beautiful heatmap is not evidence.
A polished liquidation-map interface is now easy to reproduce. The difficult work is keeping every estimate bounded by the market that could actually produce it.
Inventory bound
Do the estimated liquidations remain plausible relative to observable open interest on that venue and instrument?
Contract math
Are inverse, linear and quanto contracts converted in the correct units instead of mixed into one impressive-looking number?
Mark and index mechanics
Does the model reflect the price that actually triggers liquidation, including the venue’s index and basis rules?
Market provenance
Can the user identify the venue, instrument, timestamp, aggregation rule and staleness of the underlying observations?
Tape validation
Do estimated zones remain useful when compared with later trades, order-book reactions and out-of-sample market behavior?
Normalized intensity
Does the visualization compare risk coherently, or does it present unbounded color intensity as if it were audited dollar inventory?
A liquidation estimate must reconcile with observable inventory. If a single-venue result materially exceeds eligible open interest, the publisher must explain its time window, contract conversion, newly opened positions and any double-counting.
Why we opened the curtain.
Extreme leverage is not a gift to traders. Combined with volatile collateral, thin reference markets and forced execution, it creates conditions in which undercollateralized traders can be forced to transfer inventory at the worst moment to better-prepared counterparties.
The map’s first job is defensive: help you build a mental model of where not to be liquidated. Its second is to help disciplined traders study where forced inventory, volatility and potential mean reversion meet.
Survive first
Stay overcollateralized. Treat leverage as a risk budget, never as free purchasing power.
Watch the tape
Inspect the source, the trades, the order book and the dealers’ reaction. Price alone is the last page of the story.
Build your own model
Use the data to challenge a thesis—not to outsource judgment to a bright cluster on a screen.
Our mission is still the same: rebalance the odds, let independent traders compete with better-informed participants, and help more people keep—and hopefully accumulate—Bitcoin along the way.
What traders use today.
LiqMap, Heatmap, KF-Trade Signals, GEX+, TOF, API and MCP extend the same market-structure research into distinct workflows.
LiqMap & Heatmap
LiqMap shows modeled liquidation concentration by price. Heatmap adds its evolution through time.
Explore the Heatmap →KF-Trade Signals
Liquidation-based model outputs classified into direction, target, horizon, model Z-score and signal strength.
Compare plans →GEX+, TOF & market data
Options exposure and toxic-order-flow views add context around price action.
See the full terminal →API & MCP
Query Kingfisher datasets from your own software or a compatible agent workflow.
Read the MCP guide →Premium and Pro include live KF-Trade Signals. Free accounts can review signals after a 12-hour delay in the historical Chart view. The API and MCP server provide programmatic access to Kingfisher datasets.
See the market before the sweep sees you.
Open the original liquidation map or compare plans for live access to the full terminal.