
Revolutionize Your Trading with The KF Liquidation Heatmap
The Ultimate Crypto Trading Tool
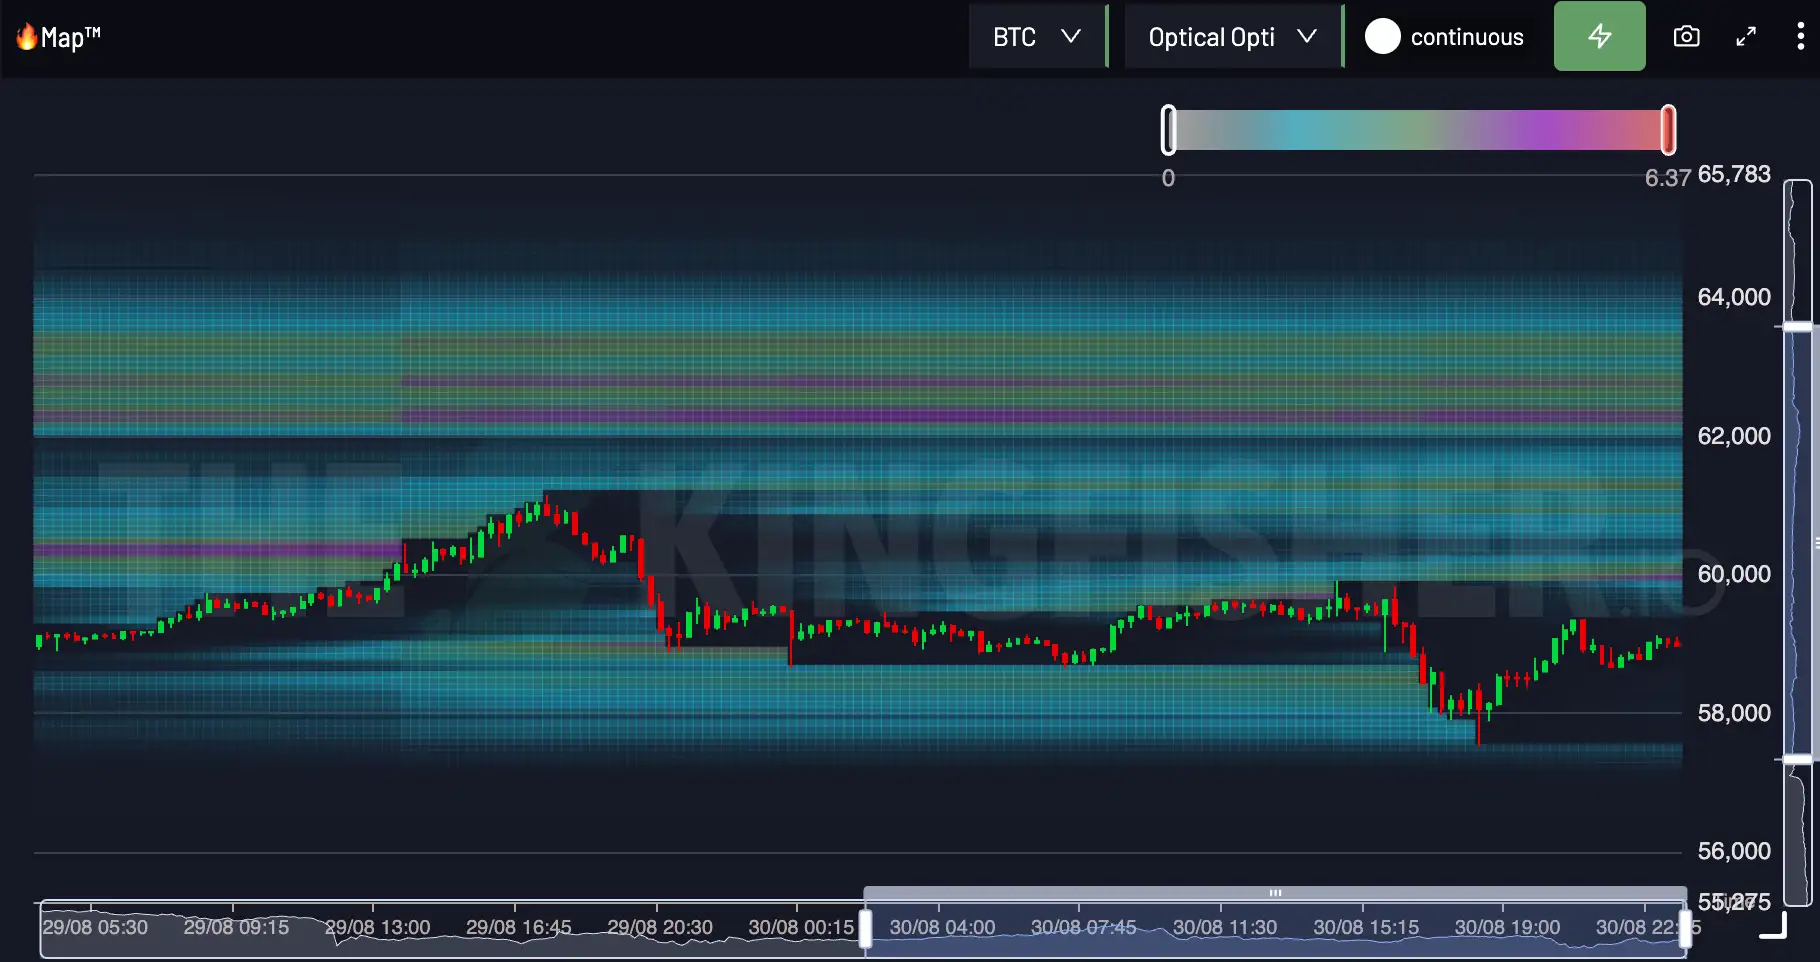
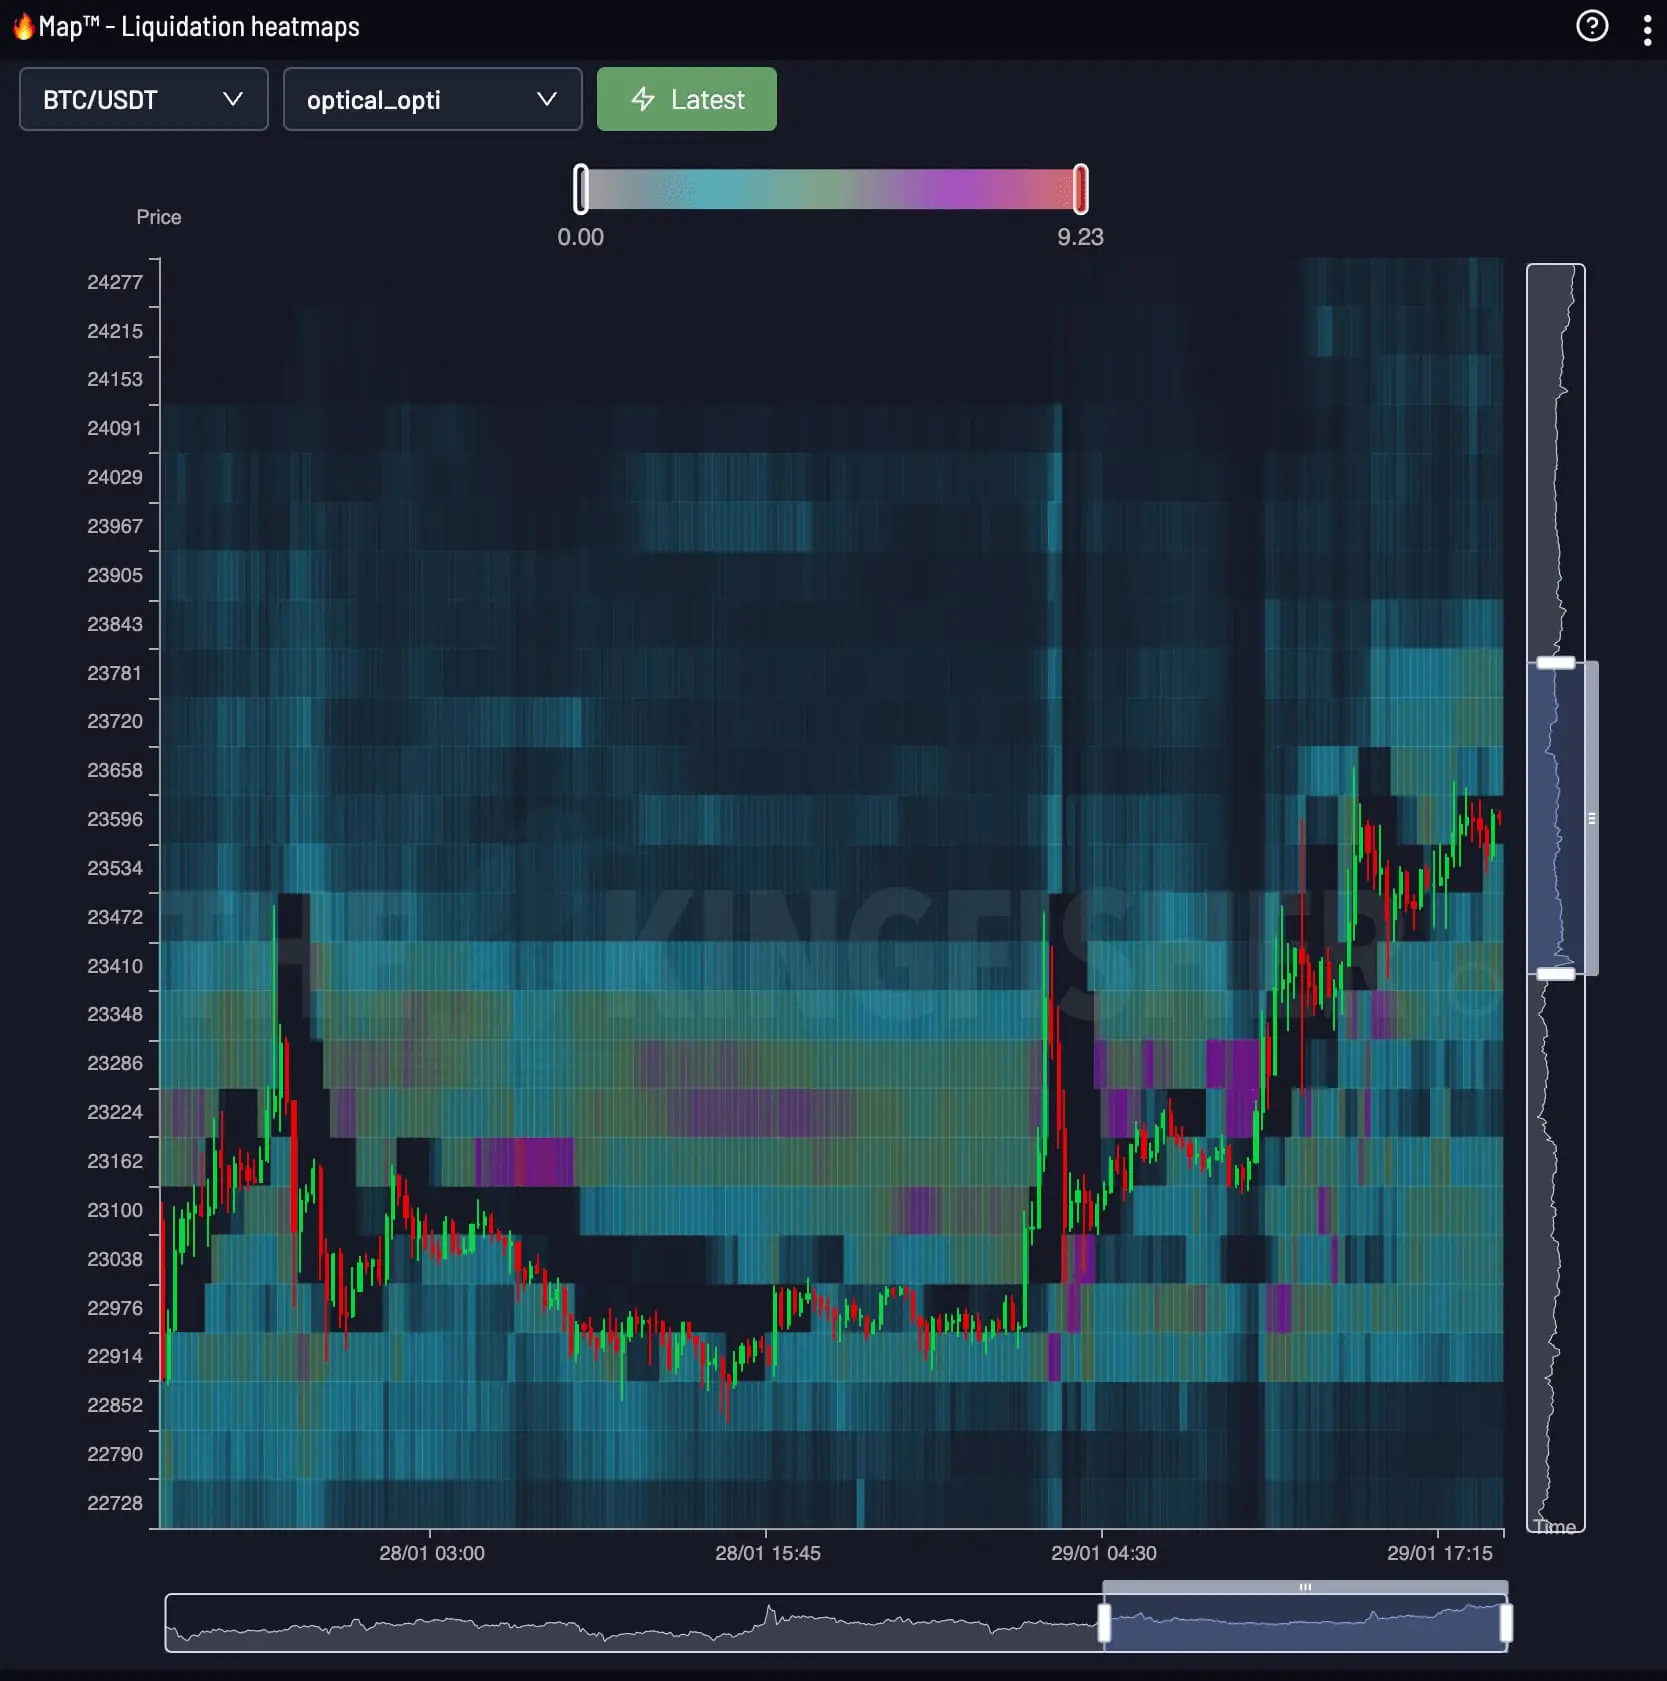
Why Liquidation Clusters Matter in Crypto Trading
We all know that crypto markets are volatile, but did you know that liquidations play a huge role in this volatility? Liquidation clusters occur when a large number of traders close their positions at the same time, causing a sudden drop or spike in price.
With The KF Liquidation Heatmap, you'll be able to spot these clusters and turn them into profits.
The KF Liquidation Heatmap: Your New Trading Companion
The KF Liquidation Heatmap is the ultimate trading tool for crypto traders. With its advanced algorithms and heatmap visualization, you'll be able to see the market in a whole new way. Quickly identify trends, spot liquidation clusters, and make informed trading decisions.
See the Power of Z-Score Analysis: We use Z-Scores to provide a standardized measure of cluster size, giving you a more accurate and reliable picture of market volatility.
Easily Filter Clusters Per Z-Score
The KF Liquidation Heatmaps make it effortless to uncover the price levels that matter most in terms of hidden liquidity and liquidation clusters. By filtering the Z-Score of the clusters, you can quickly identify the largest and most significant clusters, allowing you to make informed trading decisions.
Hear It From Our Traders
"Kingfisher has allowed me to be more precise and get a much better entry and exit. It gives me a better perspective on where the market is most likely to go next." - sh*****@gmail.com
"Liq maps help a lot to find the right entry or TP/SL" - mm******@gmail.com
"My trading performance increased significantly, knowing where most liquidations helped me understand the market" - ah*****@proton.me
Read more
Become a King of Crypto Trading with The KF Liquidation Heatmap
Join the ranks of successful crypto traders. Don't miss out on the opportunity to improve your trading results, start using The KF Liquidation Heatmap today.
Frequently Asked Questions
Everything you need to know about Bitcoin liquidation heatmaps
What is a Bitcoin liquidation heatmap?
A Bitcoin liquidation heatmap is a visual tool that displays where liquidation clusters are located across different price levels. It shows traders exactly where large numbers of leveraged positions will be forced to close, helping predict potential price reversals and cascading liquidations.
How do I read a BTC liquidation heatmap?
Look for bright areas or clusters on the heatmap - these represent price levels with high liquidation concentrations. Larger clusters indicate more significant price levels where liquidations may trigger volatile movements. Use Z-Score filtering to identify statistically significant clusters that matter most.
Where can I find free liquidation heatmaps?
The Kingfisher offers real-time Bitcoin liquidation heatmaps with free access. No sign-up is required to view the heatmap. Simply visit thekingfisher.io to start tracking liquidation clusters instantly with superior accuracy compared to other tools.
Why are liquidation clusters important for trading?
Liquidation clusters act as magnets for price. When price approaches a large cluster, liquidations trigger automatically, creating cascade effects. Trading around these clusters provides significant opportunities, but they also pose risks if you're caught on the wrong side. The heatmap shows you exactly where these danger zones are.