
Supercharge Your Trading
The KF-Liquidation Maps
Integrate exclusive liquidation maps, heatmaps, and tools to gain a decisive edge.
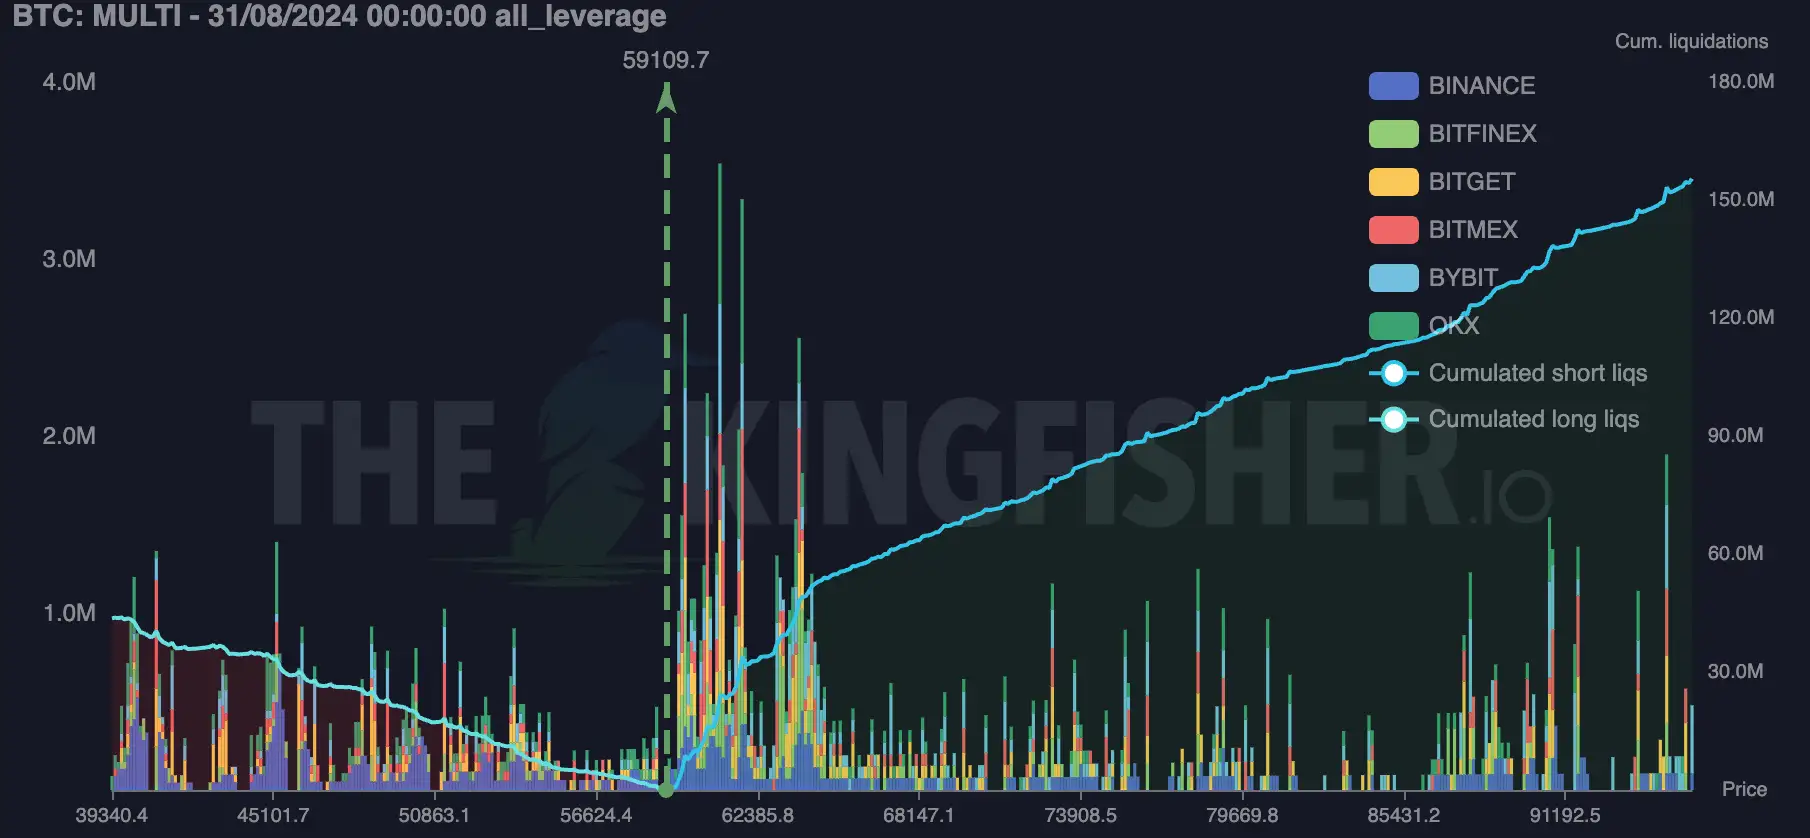
Proprietary Liquidation Maps: Unmatched Precision
Gain a decisive advantage with our exclusive Liqmap and Heatmaps.
Visualize potential liquidation events across multiple exchanges and timeframes, allowing you to anticipate market movements and optimize your trading strategies.
This groundbreaking data is only available through Kingfisher. We are the original creators and sole providers.
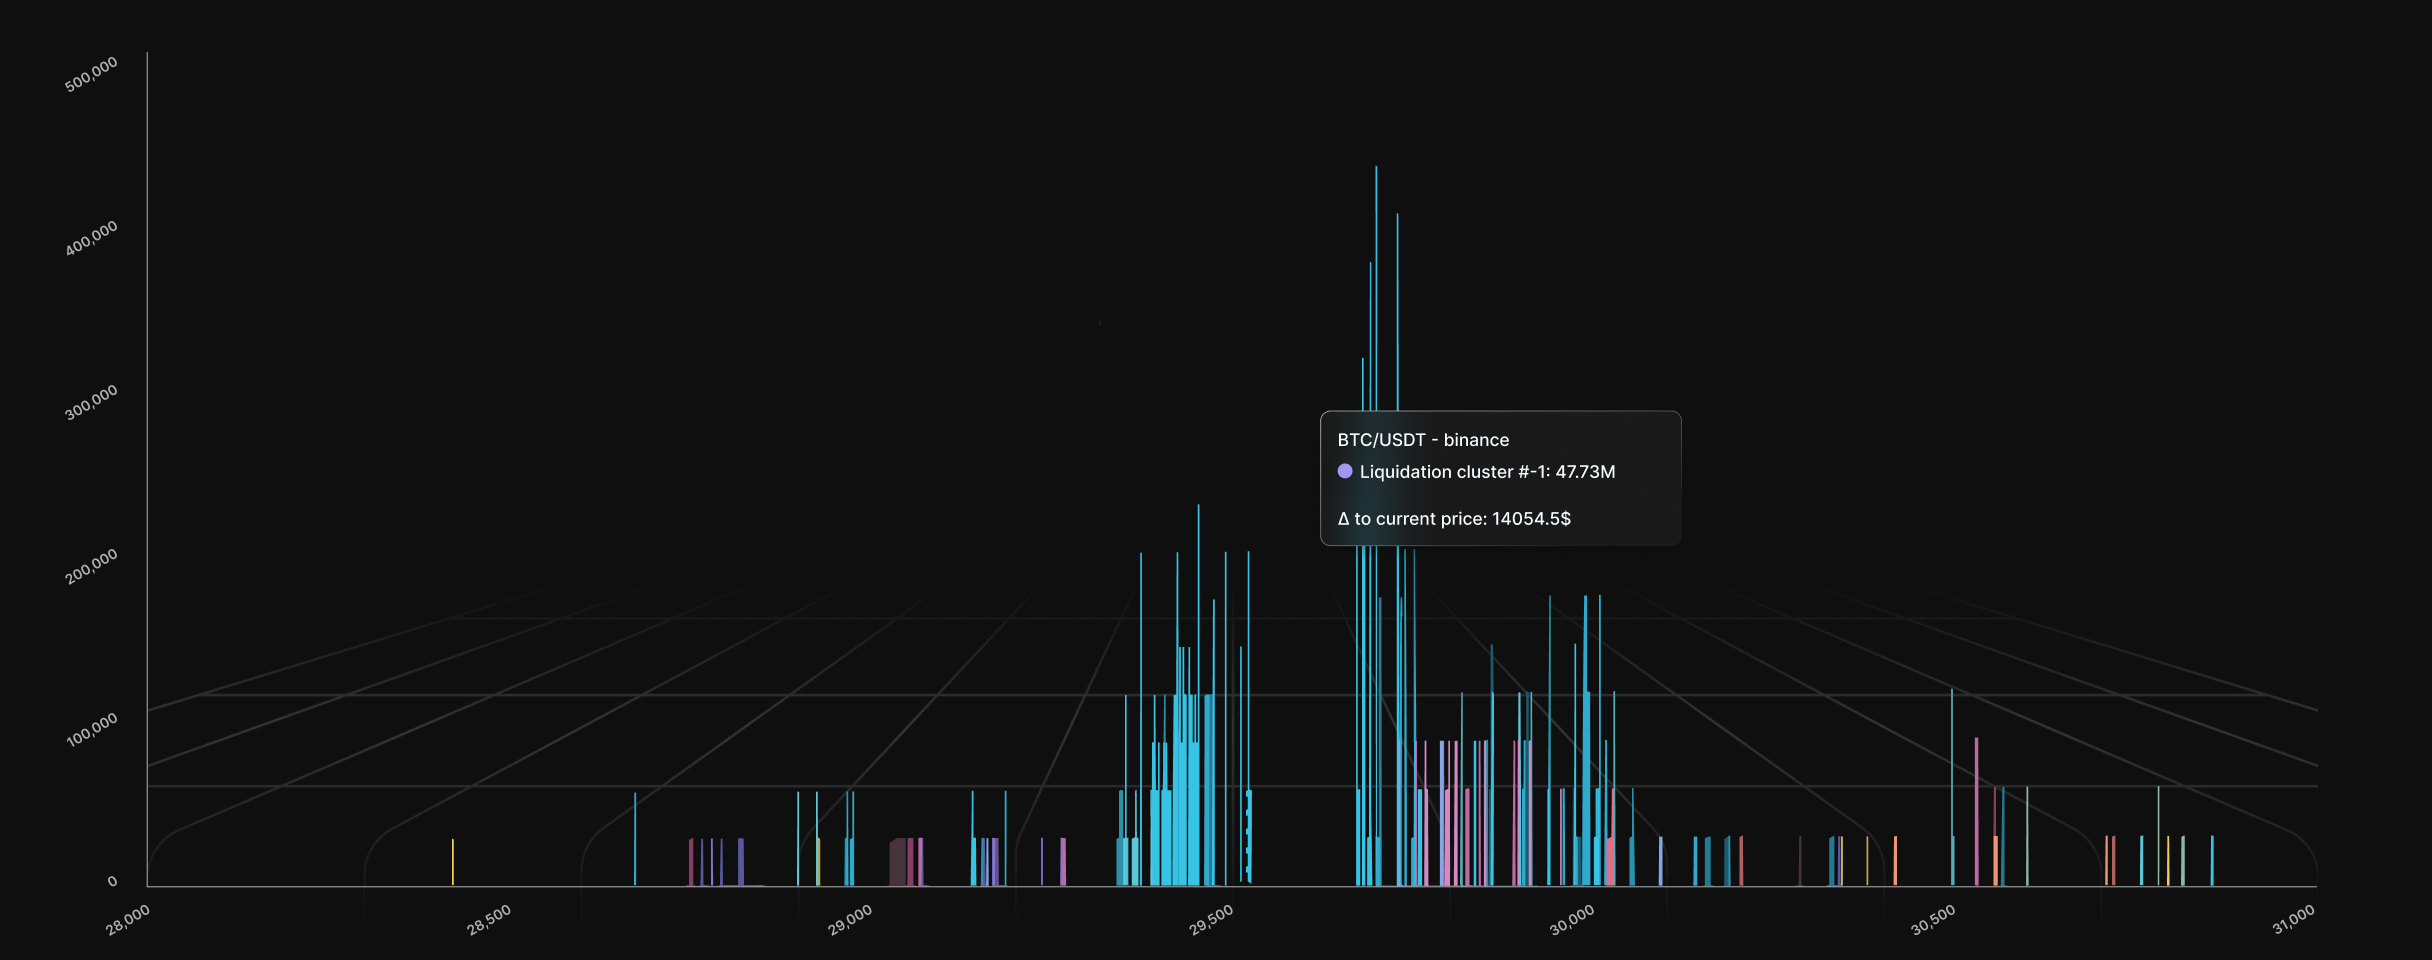
Decode Market Volatility with Unprecedented Clarity
Our Liquidation Heatmaps provide a unique perspective on market vulnerability, empowering you to:
- Identify high-risk areas: Pinpoint potential liquidation clusters and adjust your positions accordingly.
- Anticipate market volatility: Forecast price swings based on liquidation pressure and capitalize on emerging opportunities.
- Refine your trading strategies: Make informed decisions based on comprehensive, real-time liquidation data.
Ready to unlock these exclusive insights?
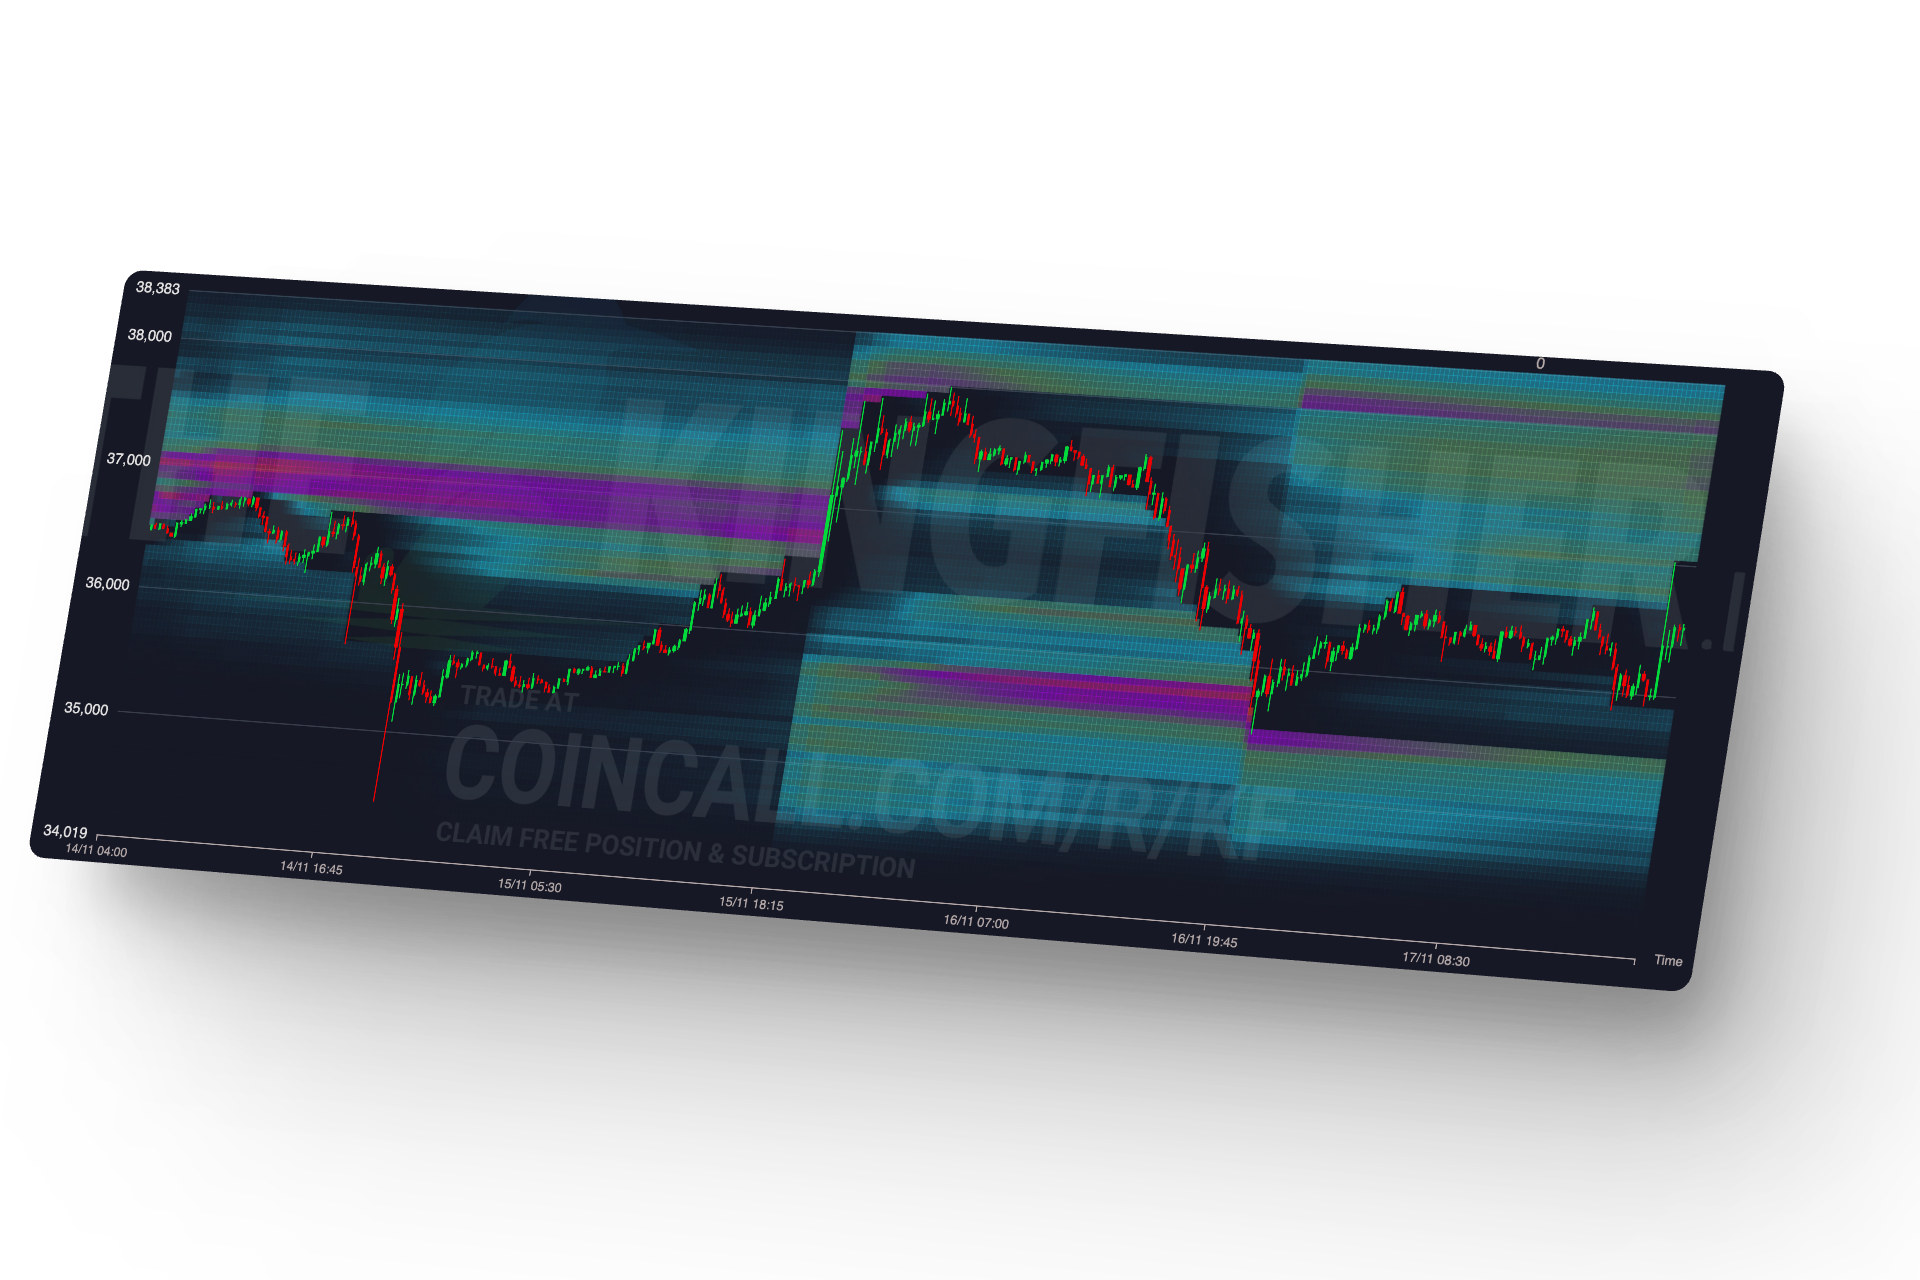
The Kingfisher Advantage: Why Our Liquidation Maps Are Unmatched
Since 2015, the Kingfisher founders have been pioneers in the field of liquidation analysis, using our proprietary maps for highly profitable algorithmic trading. While competitors often struggle to understand and effectively use liquidation data, our algorithms have consistently delivered over 30% monthly excess returns.
The Kingfisher's LiqMaps stand out for their unparalleled accuracy and reliability. Unlike alternative solutions, our maps are built on a deep understanding of market dynamics, going much further than naive open interest variation, leverage mix, and position timing. We were the first to introduce liquidation maps to the market, and our years of experience continue to set us apart.
The KF-LiqMaps empowers you to:
- Catch the wicks with precision
- Fill large orders with minimal slippage
- Backstop the market with confidence
- Exit positions when liquidity is optimal
Join thousands of traders who have already discovered the alpha. Unlock the power of Kingfisher's LiqMaps and become a winner in the crypto market.
This groundbreaking data is only available through The Kingfisher. We are the original creators and sole providers of the liquidation maps.
Hear It From Our Traders
"Kingfisher has allowed me to be more precise and get a much better entry and exit. It gives me a better perspective on where the market is most likely to go next." - sh*****@gmail.com
"Liq maps help a lot to find the right entry or TP/SL" - mm******@gmail.com
"My trading performance increased significantly, knowing where most liquidations helped me understand the market" - ah*****@proton.me
Read more
Start improving your performance today!
Join over 4,000 traders exploring Bitcoin liquidations with us.
Frequently Asked Questions
Everything you need to know about BTC liquidation maps
What is a BTC liquidation map?
A BTC liquidation map is a real-time visualization tool that displays where leveraged Bitcoin positions will be forced to close across different price levels. It shows traders the exact price points where cascading liquidations may occur, helping predict volatile price movements before they happen.
How does a liquidation map differ from a heatmap?
While both tools show liquidation concentrations, a liquidation map provides a more detailed, multi-exchange view of liquidation levels across timeframes. The Kingfisher's LiqMap goes beyond simple heatmaps by incorporating Z-Score analysis and tracking liquidation clusters across multiple exchanges simultaneously for superior accuracy.
Can I use liquidation maps for day trading?
Yes, liquidation maps are excellent for day trading. They help identify intraday support and resistance levels, show where price may get rejected, and reveal optimal entry/exit points. Day traders use them to avoid getting caught in cascade liquidations and to time entries around key liquidation levels with precision.
Why is Kingfisher's liquidation map more accurate?
The Kingfisher has been pioneering liquidation analysis since 2015. Our proprietary algorithms go far beyond naive open interest calculations, incorporating leverage mix, position timing, and market microstructure. We were the first to introduce liquidation maps to the market, delivering over 30% monthly excess returns in our algorithmic trading.