
What are Bollinger Bands? Complete Guide to Bollinger Bands Trading 2026
Introduction: Measuring Volatility Dynamically
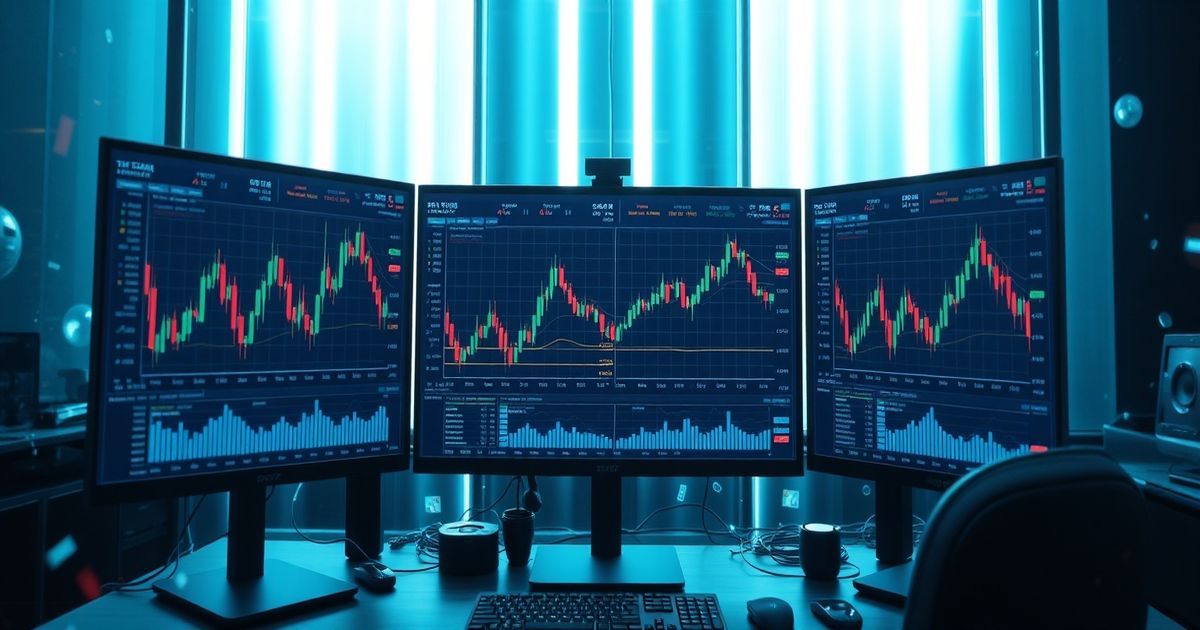
Bollinger Bands, developed by John Bollinger in the 1980s, are one of the most versatile technical indicators in crypto trading. They dynamically adjust to volatility, expanding during volatile periods and contracting during calm markets.
Why Bollinger Bands matter:
- Measure volatility dynamically
- Identify overbought/oversold conditions
- Signal potential breakouts
- Versatile trading tool
This comprehensive guide explains what are Bollinger Bands, how to calculate them, trading strategies (squeeze, mean reversion), and how Kingfisher's data enhances Bollinger Bands analysis.
What are Bollinger Bands?
Basic Definition
Bollinger Bands = A volatility indicator consisting of three lines: a simple moving average (middle band) and two standard deviation bands (upper and lower) that expand and contract with volatility.
Visual Representation:
Price
↑
│ ╱╲ Upper Band (+2 SD)
│ ╱ ╲ ╱╲
│ ╱ ╲ ╱ ╲ Middle Band (20 SMA)
│───╱──────╲╱────╲─── Lower Band (-2 SD)
│ ╱ ╲
│ ╱ ╲
└─────────────────────→ Time
╰─ Squeeze (low volatility)
Three Components:
- Middle Band: 20-period Simple Moving Average (SMA)
- Upper Band: Middle Band + (2 × Standard Deviation)
- Lower Band: Middle Band - (2 × Standard Deviation)
Bollinger Bands Calculation
Step-by-Step
Step 1: Calculate Middle Band (20 SMA)
Middle Band = SMA(Close, 20)
Example:
- Last 20 closes: $48,000, $49,000, $50,000, etc.
- Average = $50,000
- Middle Band = $50,000
Step 2: Calculate Standard Deviation
σ = √(Σ(x - μ)² ÷ n)
Where:
- σ = Standard deviation
- x = Each closing price
- μ = Mean (Middle Band)
- n = Number of periods (20)
Example:
- If typical deviation from mean = $1,000
- Standard Deviation = $1,000
Step 3: Calculate Upper and Lower Bands
Upper Band = Middle Band + (2 × σ)
Lower Band = Middle Band - (2 × σ)
Example:
- Middle Band: $50,000
- Standard Deviation: $1,000
- Upper Band: $50,000 + (2 × $1,000) = $52,000
- Lower Band: $50,000 - (2 × $1,000) = $48,000
- Bands: $48,000 - $52,000
Bollinger Bands Interpretation
1. Band Width (Volatility)
Formula:
Bandwidth = (Upper Band - Lower Band) ÷ Middle Band
Interpretation:
Narrow Bands (Squeeze):
- Low volatility
- Consolidation phase
- Potential breakout coming
Wide Bands (Expansion):
- High volatility
- Trending phase
- Momentum established
Example:
| Bandwidth | Interpretation |
|---|---|
| < 2% | Extreme squeeze (breakout imminent) |
| 2-4% | Low volatility (normal for crypto) |
| 4-8% | Moderate volatility |
| > 8% | High volatility (trending) |
2. %B (Percent B)
Formula:
%B = (Price - Lower Band) ÷ (Upper Band - Lower Band)
Interpretation:
| %B Value | Meaning |
|---|---|
| > 1.0 | Price above upper band (overbought) |
| 0.8-1.0 | Near upper band (strong uptrend) |
| 0.5 | At middle band (neutral) |
| 0.2-0.5 | Near lower band (strong downtrend) |
| < 0 | Price below lower band (oversold) |
Example:
- Price: $51,000
- Upper Band: $52,000
- Lower Band: $48,000
- %B = ($51,000 - $48,000) ÷ ($52,000 - $48,000) = 0.75
- In upper half of bands (bullish)
Bollinger Bands Trading Strategies
Strategy 1: The Squeeze Play
Concept: Trade breakouts from low volatility periods.
Setup:
- Bands narrow significantly (Bandwidth < 2%)
- Price consolidates near middle band
- Volume declines
- Squeeze!
Entry:
- Price breaks out of bands
- Volume confirms
- Trade the breakout
Kingfisher Enhancement:
- Confirm with liquidation clusters
- Breakout at major liquidation level = stronger
- Confluence
Example:
BTC Setup:
- Range: $49,500-$50,500 (1% range, 30 days)
- Bollinger Bandwidth: 1.5% (extreme squeeze)
- Kingfisher shows: 5,000 BTC liquidations at $48,000 and $52,000
- Breakout above $50,500
- Buy signal
Why It Works:
- Low volatility precedes high volatility
- Accumulation before distribution
- Energy release
Strategy 2: Mean Reversion
Concept: Price returns to mean after extreme extensions.
Setup:
- Price touches upper band (overbought)
- Kingfisher: No major liquidations supporting move
- Sell/Short
OR:
- Price touches lower band (oversold)
- Kingfisher: No major liquidations supporting drop
- Buy/Cover
Example:
BTC Setup:
- Price: $52,500
- Upper Band: $52,000
- %B: 1.25 (overextended)
- Kingfisher: No liquidation clusters above $52,500
- Sell signal
Kingfisher Confirmation:
- If liquidations support move, don't fade
- Only fade when no fuel for continuation
- Smart fading
Strategy 3: Band Walk
Concept: Price rides along upper or lower band.
Uptrend Band Walk:
- Price consistently touches upper band
- Minor pullbacks to middle band
- Strong trend
Entry:
- Buy when price pulls back to middle band
- Sell when it reaches upper band again
- Trend following
Example:
BTC Uptrend:
- Day 1: Price touches upper band ($52,000)
- Day 2: Pulls back to middle ($50,000)
- Day 3: Returns to upper band ($52,500)
- Day 4: Touches upper band ($53,000)
- Buy pullbacks to middle
Stop Loss:
- Below middle band
- Trend invalidation
Strategy 4: Double Bottom at Lower Band
Concept: Bullish reversal when price holds lower band twice.
Setup:
- Price drops to lower band
- Bounces back to middle
- Returns to lower band but holds
- Buy signal
Example:
BTC Setup:
- First touch: $48,000 (lower band)
- Bounce to $50,000 (middle)
- Return to $48,000 (lower band) - holds!
- Buy with stop below $47,500
Why It Works:
- Support tested twice
- Sellers exhausted at lower band
- Double bottom
Bollinger Bands with Kingfisher
Enhanced Bollinger Bands Analysis
What Kingfisher Adds:
1. Bollinger Bands + Liquidation Levels:
- Price at upper band + Long liquidations above = Stronger signal
- Price at lower band + Short liquidations below = Stronger signal
- Confluence
2. Bollinger Bands + Open Interest:
- Band squeeze + Rising OI = Coiled spring
- Band expansion + Falling OI = Blow-off top
- Context
3. Bollinger Bands + GEX+:
- Price at upper band + Positive GEX = Dealers short gamma (squeeze continues)
- Price at lower band + Negative GEX = Dealers short gamma (bounce likely)
- Dealer positioning
Example: Bollinger Bands + Kingfisher
Scenario: Squeeze with Confluence
Setup:
- BTC: $50,000
- Bollinger Bandwidth: 1.8% (extreme squeeze)
- Kingfisher shows:
- 5,000 BTC long liquidations at $48,500
- 5,000 BTC short liquidations at $51,500
- Coiled spring
Trading Decision:
- Breakout either direction will be explosive
- Wait for directional confirmation
- Trade the confirmed breakout
Execution:
- Breakout above $51,000 → Buy
- Target: $52,500 (short liquidations)
- Stop: $50,000
- High probability trade
Common Bollinger Bands Mistakes
Mistake 1: Trading Every Touch
Problem: "Price touched upper band, sell!"
Reality:
- In strong trends, price can ride bands
- Selling too early = missing profits
- Premature exit
Solution:
- Use %B to gauge overextension
- Only sell when %B > 1.2 (extreme)
- Patience
Mistake 2: Ignoring Bandwidth
Problem: Using same strategy for all volatility regimes.
Reality:
- Mean reversion fails in wide bands (trending)
- Trend following fails in narrow bands (ranging)
- Adapt to regime
Solution:
- Identify bandwidth regime
- Switch strategies accordingly
- Flexibility
Mistake 3: No Confirmation
Problem: Trading Bollinger Bands touches alone.
Reality:
- Bands give context, not signals
- Need confirmation (volume, price action)
- Multi-tool approach
Solution:
- Wait for candle confirmation
- Use Kingfisher for liquidation confluence
- Confirmation
Bollinger Bands in Different Markets
Bull Market (Uptrend)
Characteristics:
- Price spends more time near upper band
- Pullbacks to middle band are buying opportunities
- Band walks
Strategy:
- Buy pullbacks to middle band
- Sell at upper band resistance
- Trend following
Bear Market (Downtrend)
Characteristics:
- Price spends more time near lower band
- Rallies to middle band are selling opportunities
- Downside pressure
Strategy:
- Short rallies to middle band
- Cover at lower band support
- Trend following
Range Market (Sideways)
Characteristics:
- Price oscillates between bands
- Mean reversion works
- Range trading
Strategy:
- Sell at upper band
- Buy at lower band
- Mean reversion
Bollinger Bands Settings
Standard Settings (John Bollinger's Original)
Middle Band: 20 SMA Standard Deviation: 2
Use For:
- Most trading situations
- Balances sensitivity and noise
- Default choice
Alternative Settings
Short-Term Trading (Day Trading):
- Middle Band: 10 SMA
- Standard Deviation: 1.5
- More sensitive
Long-Term Trading (Swing Trading):
- Middle Band: 50 SMA
- Standard Deviation: 2.5
- Fewer false signals
Scalping Settings
Ultra-Short Term:
- Middle Band: 5 SMA
- Standard Deviation: 1.0
- Very sensitive
- More noise
Bollinger Bands and Other Indicators
Bollinger Bands + RSI
Overbought Confirmation:
- Price at upper band + RSI > 70
- Strong sell signal
- Multiple confirmations
Divergence:
- Price makes higher high at upper band
- RSI makes lower high
- Bearish divergence
Bollinger Bands + MACD
Momentum Confirmation:
- Price breaks upper band
- MACD also breaks high
- Strong momentum
Momentum Divergence:
- Price at upper band
- MACD showing weakness
- Potential reversal
Advanced Bollinger Bands Concepts
1. Bollinger Band Squeeze
The Setup:
- Bandwidth at 6-month low
- Price consolidation
- Energy building
The Release:
- Explosive move when bands expand
- Volume confirms
- Breakout
Kingfisher Application:
- Check liquidation clusters for direction
- More clusters one way = likely direction
- Predictive bias
2. Bollinger Band %B Histogram
Visualization:
- Plot %B as histogram
- Above 0.5 = bullish territory
- Below 0.5 = bearish territory
- Clear signals
3. Bollinger Band Fibonacci
Concept: Use Fibonacci ratios for bands.
Alternative Bands:
- Upper: Middle + (1.618 × σ)
- Lower: Middle - (1.618 × σ)
- Different approach
Practical Bollinger Bands Examples
Example 1: BTC Squeeze Play
Setup:
- BTC range: $49,500-$50,500 (1% range, 30 days)
- Bollinger Bandwidth: 1.5% (6-month low)
- Kingfisher: Major liquidations at $48,000 and $52,000
- Squeeze
Trade:
- Breakout above $50,500
- Buy with stop at $50,000
- Target: $52,000 (measured move)
Outcome:
- BTC rallies to $52,500
- Profit: $1,500 (+3%)
- Successful squeeze trade
Example 2: ETH Mean Reversion
Setup:
- ETH: $3,200
- Upper Bollinger Band: $3,100
- %B: 1.33 (extremely overbought)
- Kingfisher: No liquidation clusters above $3,200
- Fade the extreme
Trade:
- Short at $3,200
- Stop: $3,300
- Target: $3,000 (middle band)
Outcome:
- ETH drops to $3,050
- Profit: $150 (-4.7%)
- Successful mean reversion
Bollinger Bands Backtesting
Variables to Test
- Period length: 10, 20, 50?
- Standard deviation: 1.5, 2, 2.5?
- Bandwidth threshold: What defines "squeeze"?
- Timeframe: 1h, 4h, Daily?
- Asset-specific: BTC vs. ETH vs. altcoins
- Optimization
Metrics to Track
Win Rate:
- Percentage of winning trades
- Target: >55%
Average Win vs. Average Loss:
- Profitable even at 40% win rate if R:R > 1.5:1
- Risk management
Tips for Better Bollinger Bands Trading
Tip 1: Understand the Market Cycle
Volatility Regimes:
- Low vol: Mean reversion works
- High vol: Trend following works
- Adapt strategy
Tip 2: Use Multiple Timeframes
Daily Bands:
- Primary trend
- Major entries/exits
- Context
4-Hour Bands:
- Fine-tune entries
- Timing precision
- Execution
Tip 3: Combine with Price Action
Bollinger Bands + Candlesticks:
- Price at upper band + Shooting Star = Sell
- Price at lower band + Hammer = Buy
- Confirmation
Tip 4: Watch Bandwidth
Squeeze Setup:
- Bandwidth at multi-period low
- Prepare for breakout
- Anticipation
Expansion:
- Bandwidth rapidly expanding
- Trend established
- Momentum
Conclusion: Bollinger Bands are Versatile
Bollinger Bands adapt to volatility, providing context for trading decisions.
Key Points:
- Understand calculation: Middle band + 2 standard deviations
- Read bandwidth: Narrow = squeeze, Wide = trend
- Use %B: Gauge overextension objectively
- Combine strategies: Squeeze, mean reversion, band walk
- Kingfisher enhances: Liquidation levels confirm band touches
With Kingfisher you get:
- Bollinger Bands + liquidation cluster confluence
- Bandwidth analysis with open interest
- %B with dealer positioning (GEX+)
- 100% data accuracy
- Enhanced Bollinger Bands trading
Master Bollinger Bands—trade volatility dynamically.
**Bollinger Bands Analysis →
Transform Your Crypto Strategy
Harness The Power of The Kingfisher's Comprehensive Market Intelligence!
Author
The Kingfisher
Related Articles

How to Pick the Right Crypto Trading App: A Decision Framework That Actually Works
Stop guessing which crypto trading app to use. This research-backed guide gives you a clear framework for evaluating security, fees, features, and usability so you can trade with confidence.

Are Interest Rates a Significant Factor in Option Pricing?
An article discussing whether interest rates play a significant role in option pricing and how they may impact cryptocurrency options. Includes a FAQ section.

Altcoin Trading Strategies 2026: Beyond Bitcoin
Master altcoin trading strategies in 2026. Learn sector rotation, narrative trading, and how Kingfisher's liquidation maps identify altcoin opportunities.

Mobile Crypto Trading Apps: UI, UX, and What Actually Works
Research-backed breakdown of crypto trading mobile app design. Learn which UI patterns increase trading accuracy, how cognitive load affects decisions, and why Kingfisher Mobile's approach stands out.