什么是比特币清算热力图?
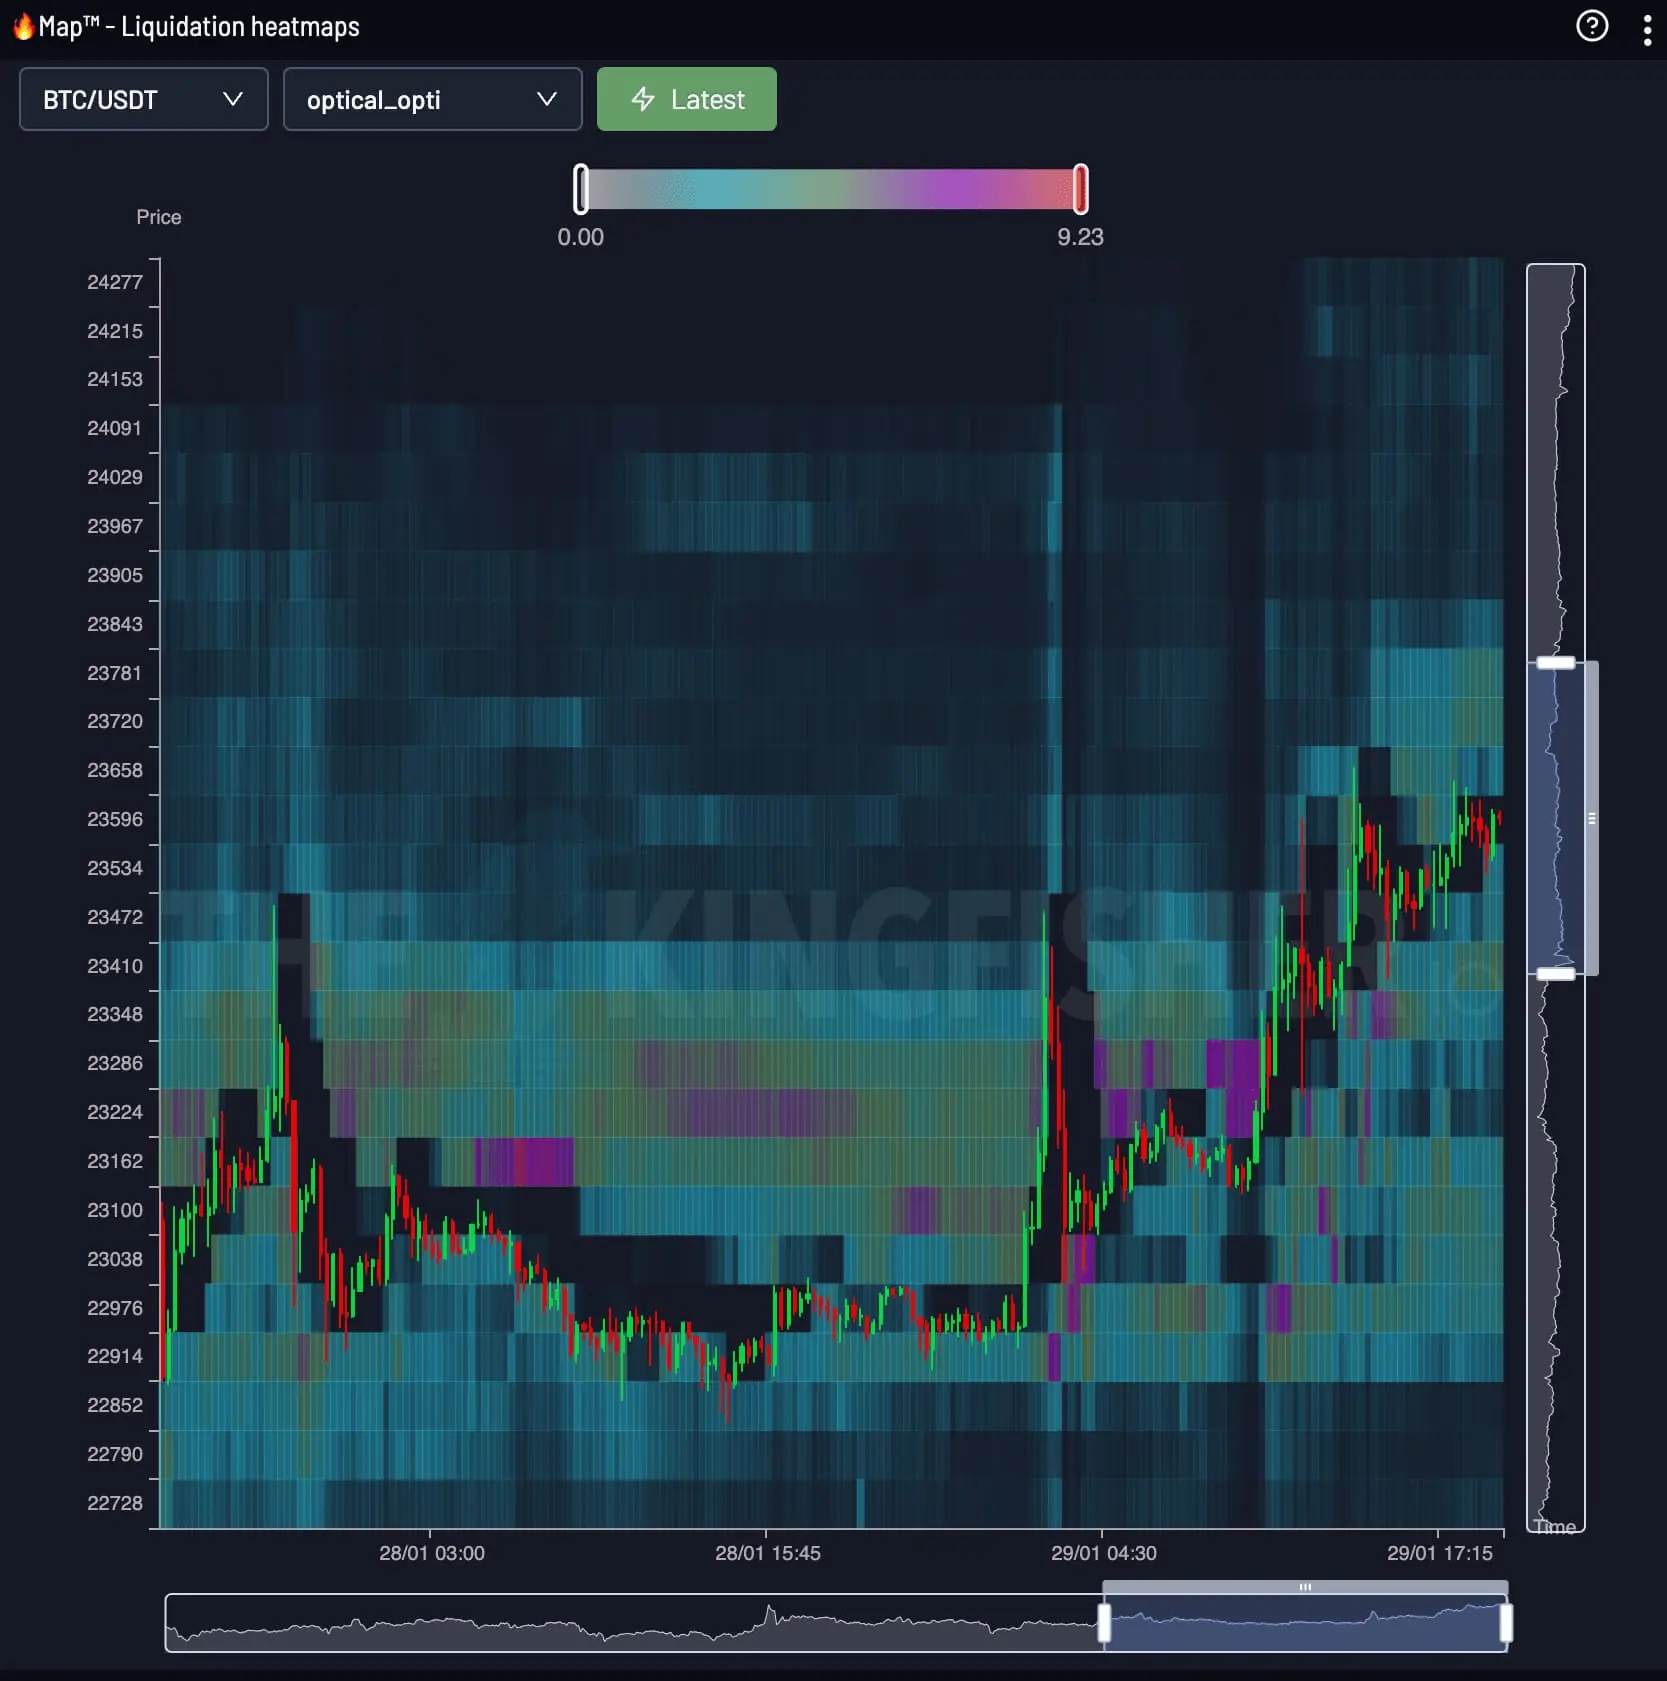
清算热力图以纵轴表示价格、横轴表示时间。


Heatmap · MKR / USDT
Maker (MKR) Real-Time Liquidation Clusters
沿价格与时间跟踪清算压力,观察杠杆头寸如何形成、移动并被清除。
Live figures return with the next data refresh. The reading guides below stand on their own.
Price × Time
The Kingfisher Heatmap 将连续的 LiqMap 读数连接成持续视图。颜色强度让主要区域及其变化一目了然。
清算热力图以纵轴表示价格、横轴表示时间。
从当前价格开始,比较上下方最亮的色带,再沿时间轴观察压力是在增强还是消退。
明亮且持续的色带显示清算压力集中的区域。色带变淡或消失,表示该压力已经减弱或被清除。
MKR / USDT
The brightest bands on the MKR map mark the price levels holding the most modeled liquidation risk, right now. Price gravitates toward these bands because forced orders wait inside them.
A stop placed inside a dense cluster gets swept by the wick that clears the band. Place yours beyond the cluster edge and size the position so that distance costs a fixed fraction of the account.
Check the distance from entry to the nearest heavy cluster before choosing leverage. The calculator below converts that distance into a liquidation price for any leverage tier.
LiqMap / Heatmap
LiqMap 展示某一时刻价格附近的清算结构。Heatmap 加入时间轴,用于跟踪这些区域如何形成、移动和消退。
| Dimension | MKR Liquidation Map | MKR Liquidity Heatmap |
|---|---|---|
| Shows | Liquidation price levels, tier by tier | Heat intensity of pressure over time |
| Axes | Price x leverage estimate | Price x time (rolling 24h) |
| Answers | Where exact levels and cluster walls sit | When pressure builds toward a level |
| Best use | Placing stops and entries | Timing the test of a level |
Traders read both together: the map gives the level, the heatmap gives the timing. Open the MKR liquidation map view for tier-by-tier levels.
Maker清算图Enter your entry price, leverage and side. The calculator returns your exact MKR liquidation price and position size before you commit margin.
Open the full MKR calculatorThe Kingfisher Terminal
在 The Kingfisher 终端打开实时 Heatmap。Premium 权限包含 Snapshot 和 Footprint 视图。
FAQ
关于比特币清算热力图您需要了解的一切
纵轴是价格,横轴是时间。当前价格下方的色带是多头清算位置,上方是空头清算位置。色带越亮,代表该价位等待清算的量越大,价格往往会先测试亮带再突破。
清算图按杠杆分层展示清算价位,用于设置止损和进场。清算热力图以 24 小时滚动窗口展示这种压力随时间的积累,用于择时。两者配合使用:清算图给位置,热力图给时机。
清算会产生市价单,放大价格冲向密集区的动能,密集区像磁铁一样吸引价格,突破后会加速走势。清算图展示的是风险区域,不是保证的价格目标。