ビットコイン清算ヒートマップとは何ですか?
清算ヒートマップは縦軸に価格、横軸に時間を配置します。


Heatmap · MKR / USDT
Maker (MKR) Real-Time Liquidation Clusters
価格と時間に沿って清算圧力を追跡し、レバレッジポジションが形成、移動、解消される流れを確認します。
Live figures return with the next data refresh. The reading guides below stand on their own.
Price × Time
The Kingfisher Heatmapは連続するLiqMapの読み取りを一つの継続的な画面にします。色の強度から主要なゾーンと変化をすぐに把握できます。
清算ヒートマップは縦軸に価格、横軸に時間を配置します。
現在価格を起点に上下の明るい帯を比較し、時間とともに圧力が強まるか薄れるかを追います。
明るく持続する帯は清算圧力が集中する場所を示します。帯が薄くなる、または消える場合、その圧力は弱まるか解消されています。
MKR / USDT
The brightest bands on the MKR map mark the price levels holding the most modeled liquidation risk, right now. Price gravitates toward these bands because forced orders wait inside them.
A stop placed inside a dense cluster gets swept by the wick that clears the band. Place yours beyond the cluster edge and size the position so that distance costs a fixed fraction of the account.
Check the distance from entry to the nearest heavy cluster before choosing leverage. The calculator below converts that distance into a liquidation price for any leverage tier.
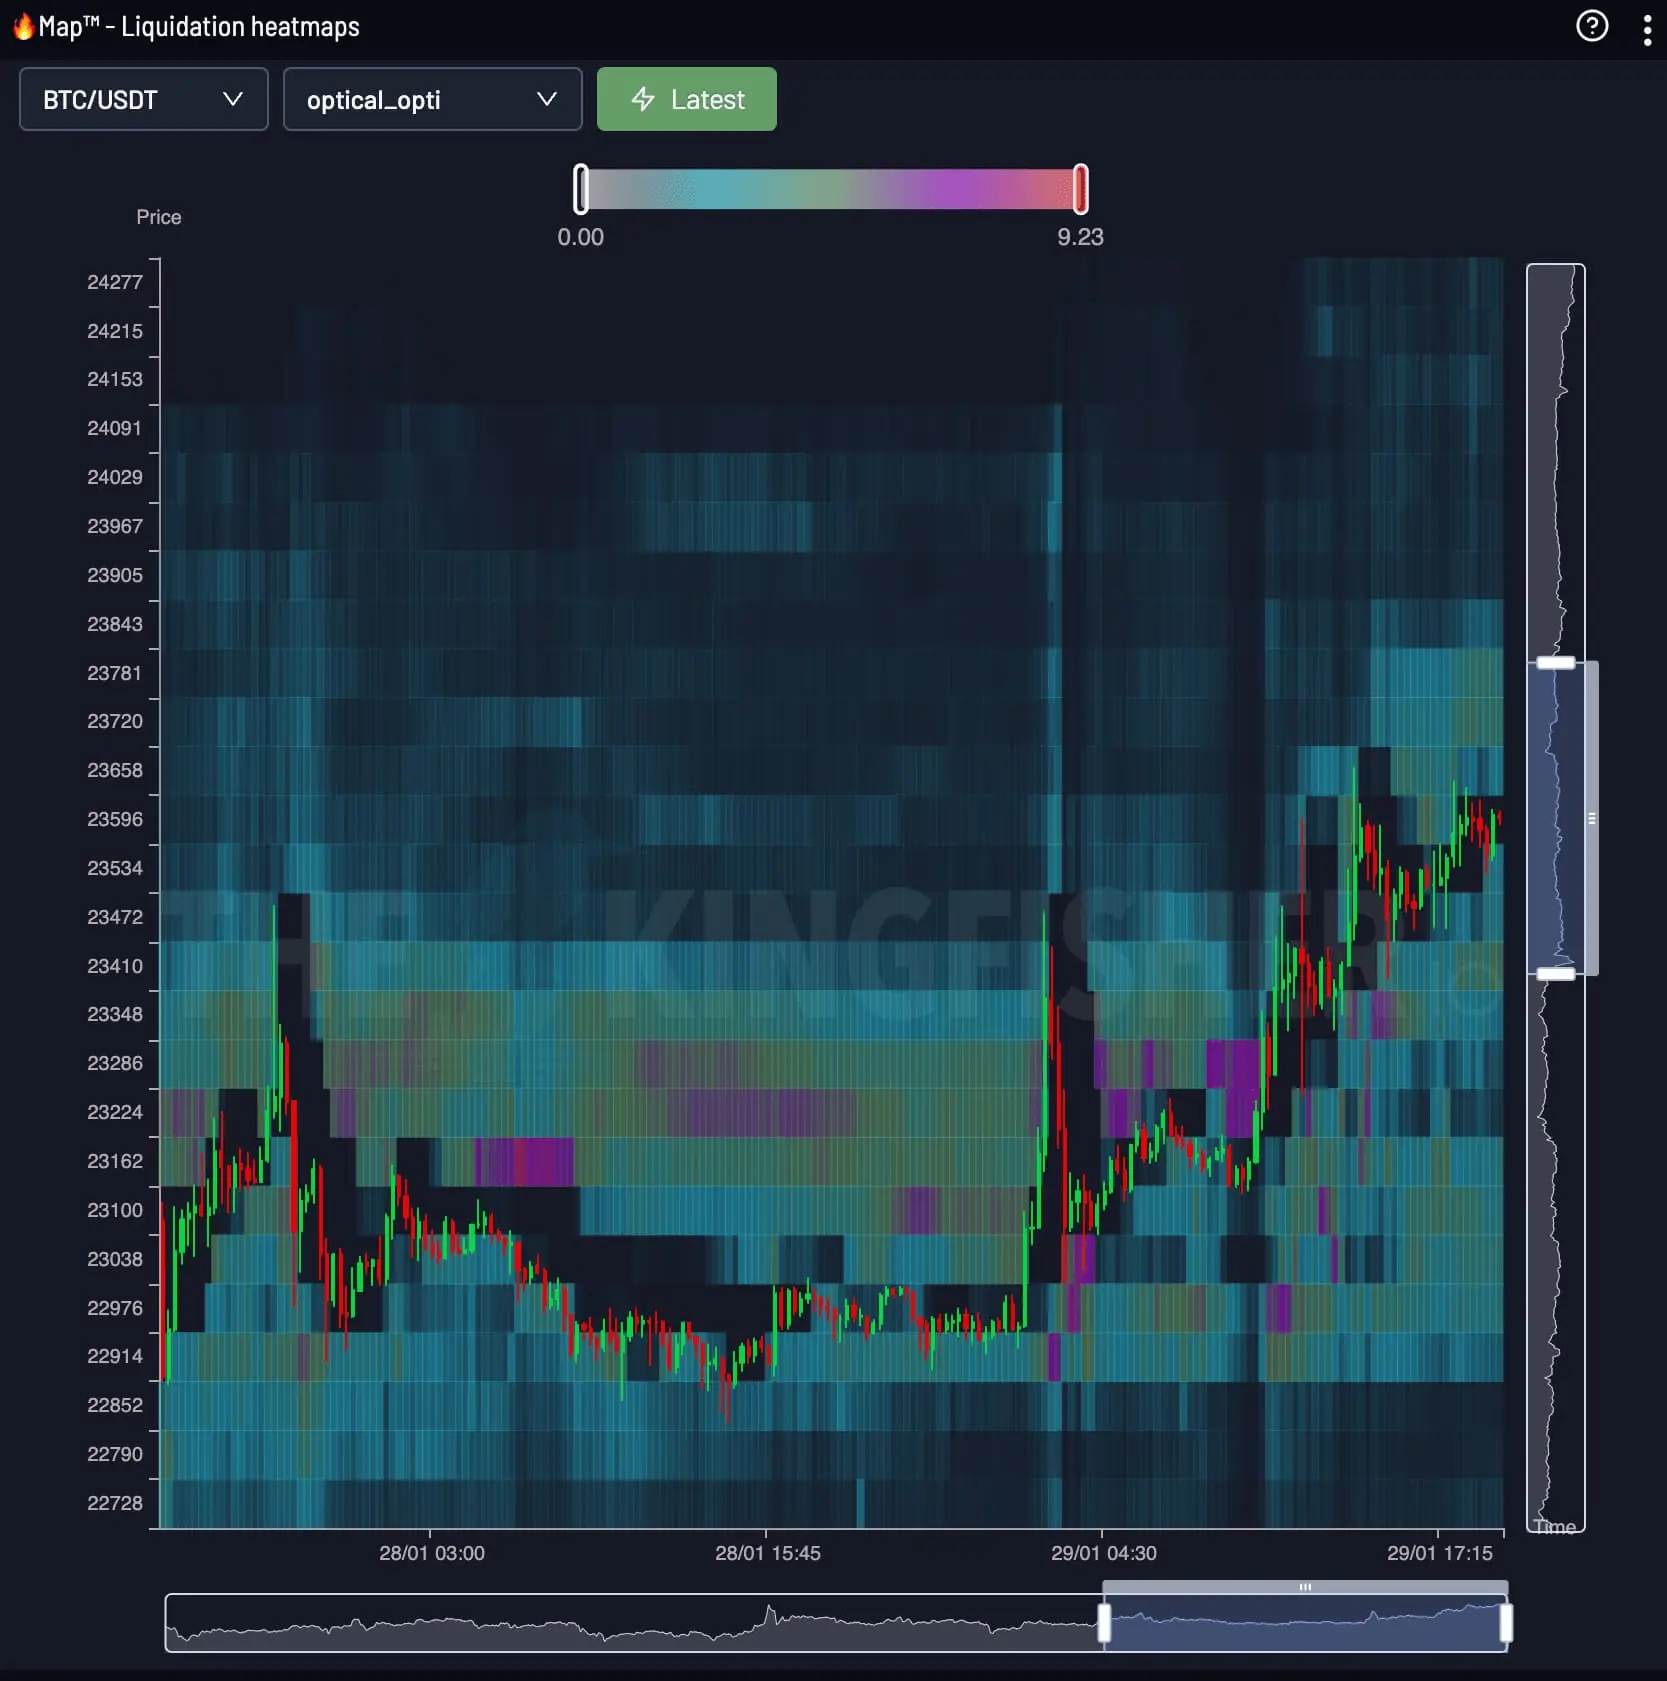
LiqMap / Heatmap
LiqMapは特定時点の価格周辺にある清算構造を表示します。Heatmapは時間軸を加え、ゾーンの形成、移動、解消を追跡します。
| Dimension | MKR Liquidation Map | MKR Liquidity Heatmap |
|---|---|---|
| Shows | Liquidation price levels, tier by tier | Heat intensity of pressure over time |
| Axes | Price x leverage estimate | Price x time (rolling 24h) |
| Answers | Where exact levels and cluster walls sit | When pressure builds toward a level |
| Best use | Placing stops and entries | Timing the test of a level |
Traders read both together: the map gives the level, the heatmap gives the timing. Open the MKR liquidation map view for tier-by-tier levels.
Maker清算マップEnter your entry price, leverage and side. The calculator returns your exact MKR liquidation price and position size before you commit margin.
Open the full MKR calculatorThe Kingfisher Terminal
The KingfisherターミナルでライブHeatmapを開けます。PremiumアクセスにはSnapshotとFootprintビューが含まれます。
FAQ
ビットコイン清算ヒートマップについて知っておくべきことすべて
縦軸が価格、横軸が時間です。現在価格の下にたまった帯はロング清算水準、上はショート水準です。帯が明るいほどその価格で清算ボリュームが多く、価格は突破前に明るい帯を試す傾向があります。
清算マップはレバレッジ別に清算価格水準を段階的に示し、ストップやエントリーの設定に使います。清算ヒートマップは24時間のローリングウィンドウでその圧力が時間とともにどこへ積もるかを示し、タイミングに使います。両方を一緒に読みます。
清算は成行注文を生み、クラスターへの動きを増幅させます。濃いクラスターは磁石のように働き、突破でインパルスが加速します。マップが示すのはリスク帯であって、保証された目標ではありません。