

CVD Trading: Confirm Liquidation Map Signals with Cumulative Volume Delta
You see a massive liquidation cluster on the map. Price is approaching. Do you buy the breakout or fade it?
Liquidation maps show you WHERE to trade. CVD shows you WHEN.
Used together, they form a powerful combination: liquidation maps identify high-probability price levels, while CVD confirms whether the market is actually absorbing or rejecting those levels.
In this guide:
- What CVD reveals about market participants
- 3 proven CVD + Liquidation Map strategies
- Real trade example: The $18,850 absorption play
- Common CVD mistakes to avoid
- Step-by-step execution checklist
What is CVD (Cumulative Volume Delta)?
CVD is a running total of volume delta, the difference between market buy orders and market sell orders in any given timeframe.
What CVD reveals:
- Volume imbalance between buyers and sellers
- Which side is dominating order flow
- The impact of aggressive trading on price
- When passive buyers/sellers are absorbing aggressive flow
Key insight: CVD shows you late FOMO participants, those chasing breakouts and selling lows. These traders fuel liquidation cascades.
How CVD Works in Crypto Markets
Arthur Hayes (BitMEX founder) explained it best: In crypto perps markets, both buying and selling are equally easy. This creates perfect conditions for emotional, impulsive trading.
The typical retail cycle:
- Price moves → FOMO traders chase
- They use leverage → Positions accumulate
- Price reaches cluster → Liquidations trigger
- CVD shows the imbalance before it happens
Why CVD + Liquidation Maps Work
Think of it like hunting:
Liquidation maps = The bait
- Show WHERE liquidity sits
- Reveal trapped positions
- Identify price targets
CVD = The feeding frenzy
- Shows WHO is aggressing
- Reveals desperation or confidence
- Confirms absorption or rejection
Combined = High-probability setup:
- Liquidation maps = WHERE liquidity clusters sit (colors identify different clusters, not direction)
- CVD = WHO is pushing it there
- Together = Trade with an edge
Real Trade Example: The $18,850 Absorption
Let's break down a textbook setup from the 2022 bear market rally.
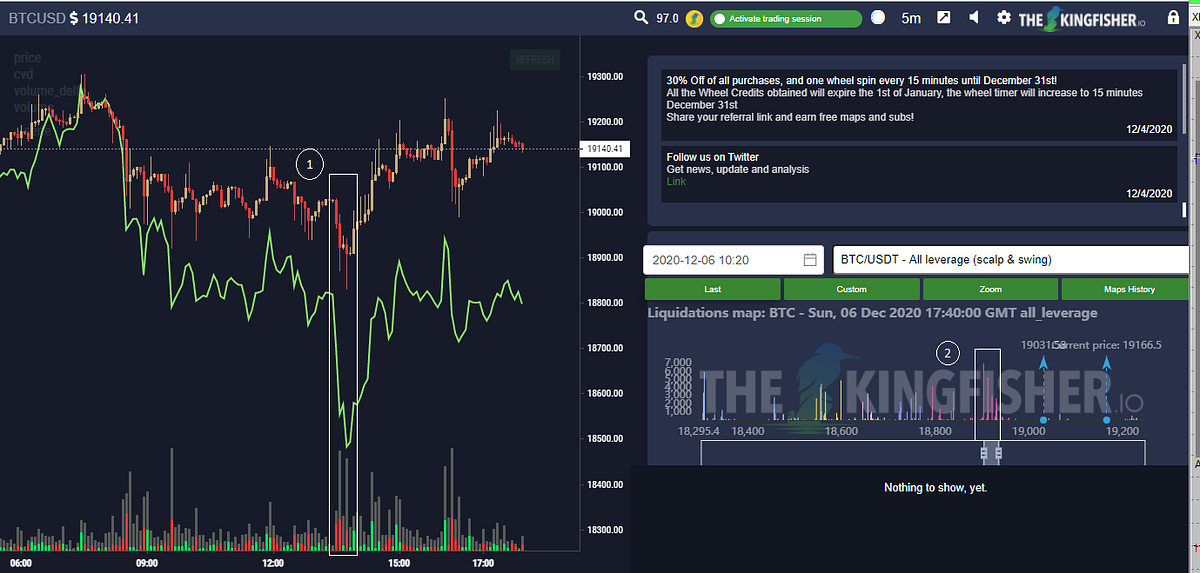
1- CVD divergence, 2- 18,850 Liquidation cluster
The Setup
Bitcoin was crashing:
- Price hammered from $22K to $18K
- Panic everywhere on social media
- Retail screaming "we're going to $15K"
But the Kingfisher told a different story:
The Liquidation Map showed:
- Major cluster at $18,850
- Hundreds of short positions vulnerable
- Clear target for upward move
The CVD told the story:
- CVD diverged from price before the low
- Net selling increased into the drop
- Critical: Price didn't drop despite heavy selling
- Sellers were getting absorbed
What Was Happening (Step-by-Step)
1. Pre-drop Phase
- CVD slowly diverged as sellers entered
- Smart money accumulating passively
- Panic sellers providing liquidity
2. At the Low ($18,850)
- Selling accelerated into support
- Liquidation cluster sitting just below
- Price held despite massive sell volume
3. The Absorption Signal
- Passive buyers absorbed ALL selling
- Price refused to break down
- Short-squeeze setup in play
4. The Trigger
- Price ticked up slightly
- Shorts got nervous
- CVD turned upward
5. The Cascade
- Shorts bailed out en masse
- Fueling the up move
- Price rocketed through the cluster
What This Taught Us
This is absorption in action. When you see:
- Heavy order flow one direction
- Price barely moves
- You're watching absorption
Absorption = Smart money taking the other side
CVD + Liquidation Map Strategy: 3 Proven Setups
Setup 1: Absorption Reversal (High Win Rate)
Best for: Counter-trend trades at liquidation clusters
Setup:
- Liquidation cluster at key level
- CVD shows aggressive flow into that level
- Price holds or stalls (absorption)
- Entry: When price reverses against the flow
- Stop: Beyond the cluster
- Target: Next cluster or opposite side
Example: Heavy selling into $18,850 support, price holds, then reverses up.
Why it works:
- Smart money absorbs panic flow
- Trapped positions provide fuel
- Absorption means someone knows something
Setup 2: CVD Divergence (Explosive Moves)
Best for: Catching reversals before they happen
Setup:
- Price makes new high or low
- CVD doesn't confirm (diverges)
- Liquidation cluster nearby
- Entry: Trade the divergence back toward cluster
- Stop: Beyond recent extreme
- Target: Cluster level
Example: Price drops to new low but CVD shows sellers exhausted, buy the reversal.
Why it works:
- Divergence = Exhaustment
- No one left to push price further
- Cluster provides the catalyst
Setup 3: Flow Confirmation (Momentum Plays)
Best for: Trading with the dominant flow
Setup:
- Price approaches liquidation cluster
- CVD accelerates in direction of cluster
- Enter with the flow toward cluster
- Exit before cluster triggers (or scale out)
- Stop: When CVD flips or reverses
Example: Buying as CVD surges into short cluster above current price.
Why it works:
- Momentum fuels liquidations
- You're riding the wave
- Exit into the liquidation spike
Advanced: Spot vs. Futures CVD
Important: CVD behaves differently in spot vs. perpetual futures markets.
BTC Perpetual Futures (Preferred for Liquidation Trading)
Characteristics:
- Market buying = Market selling (equally easy)
- High emotional trading representation
- Better for liquidation analysis
- Reflects real leverage positions
Use perps for liquidation trading
BTC Spot Markets
Characteristics:
- Shorting requires borrowing
- Less emotional/impulsive trading
- Different flow dynamics
- Less reliable for liquidation setups
Not ideal for liquidation strategies
Recommendation: When trading liquidations, focus on perpetual futures CVD. That's where the leverage and emotion are.

In Kingfisher Settings: Toggle between spot and futures to compare
Multi-Exchange CVD Analysis
Kingfisher aggregates CVD across multiple exchanges. This is powerful because:
Why it matters:
- See the full market picture
- Spot exchange-specific manipulation
- Identify where smart money is active
- Confirm flow across venues
When multiple exchanges show CVD alignment in the same direction, the signal is significantly stronger.
What to watch for:
- Binance CVD diverging from others → Exchange-specific flow
- All exchanges aligned → Market-wide conviction
- Perps diverging from spot → Leverage-driven move
Common CVD Mistakes (And How to Fix Them)
| Mistake | Why It Fails | Fix |
|---|---|---|
| Trading CVD without liquidation context | False signals everywhere | Always combine with liquidation maps |
| Ignoring CVD divergence | Missing the best reversals | Watch for price/CVD mismatch closely |
| Using spot CVD for liquidations | Weaker signals, wrong dynamics | Focus on perps markets |
| Entering before absorption confirms | Too early, get stopped out | Wait for price response to flow |
| Trading CVD levels in isolation | No context, low probability | Always consider cluster location |
| Ignoring timeframe alignment | Conflicting signals | Align CVD timeframe with your trade |
Quick Reference: CVD Trading Checklist
Before entering any CVD + Liquidation trade:
Setup Confirmation:
- Liquidation cluster identified?
- CVD showing clear signal (absorption/divergence/flow)?
- Price at or approaching cluster?
- Signal and cluster aligned?
Risk Management:
- Entry level defined?
- Stop loss placed beyond cluster?
- Target at next cluster or logical level?
- Position size accounts for cluster volatility?
Execution:
- Perps CVD confirming?
- Multiple exchanges aligned?
- Timeframe matches trade duration?
All checked? Take the trade.
Advanced: CVD + TOF + GEX Combination
For professional-level analysis, combine all three:
CVD = Flow direction TOF = Information advantage GEX = Dealer positioning
The holy trinity setup:
- Liquidation cluster at key level
- CVD shows absorption or divergence
- TOF spikes (informed traders active)
- Negative GEX (volatility amplification)
Result: Explosive move incoming
Kingfisher provides all three indicators in real-time.
FAQ
Q: Which CVD timeframe should I use? A: Match it to your trade duration. 1-minute for scalping, 15-minute for day trading, 1-hour for swings.
Q: Can I trade CVD without liquidation maps? A: You can, but win rates drop significantly. Liquidation maps provide the "why" and "where", CVD provides the "when."
Q: What's the difference between CVD divergence and absorption? A: Divergence = price moves but CVD doesn't (exhaustion). Absorption = heavy flow but price doesn't move (smart money taking other side).
Q: Do all exchanges show the same CVD? A: No. Different exchanges have different user bases and flows. Look for alignment across major perps exchanges.
Q: How do I know if absorption is real? A: Price must hold despite heavy flow. If price starts breaking with the flow, absorption failed. Get out.
Get Started with CVD Trading
What Kingfisher provides:
- Real-time CVD across major exchanges (spot + perps)
- Liquidation maps with cluster visualization
- Multi-exchange CVD aggregation
- Historical CVD divergence detection
- CVD + TOF + GEX combined
- Small/medium/big CVD options to track different player sizes
Get started:
- Try Kingfisher free - Use premium features with daily spins
- Join the community - Share your CVD setups
- Documentation - Deep explore indicators
Next steps:
- Read our Toxic Order Flow guide to understand manipulation
- Check Getting Started for platform walkthrough
- Practice identifying CVD divergences and absorptions
Updated: January 2026 | Related: Toxic Order Flow Guide | Getting Started
Unlock the Potential of Crypto Trading
explore the Deep End with The Kingfisher's Advanced Market Analytics!
Author
The Kingfisher
Related Articles

How to Pick the Right Crypto Trading App: A Decision Framework That Actually Works
Stop guessing which crypto trading app to use. This research-backed guide gives you a clear framework for evaluating security, fees, features, and usability so you can trade with confidence.

Mobile Crypto Trading Apps: UI, UX, and What Actually Works
Research-backed breakdown of crypto trading mobile app design. Learn which UI patterns increase trading accuracy, how cognitive load affects decisions, and why Kingfisher Mobile's approach stands out.

Are Interest Rates a Significant Factor in Option Pricing?
An article discussing whether interest rates play a significant role in option pricing and how they may impact cryptocurrency options. Includes a FAQ section.

Altcoin Trading Strategies 2026: Beyond Bitcoin
Master altcoin trading strategies in 2026. Learn sector rotation, narrative trading, and how Kingfisher's liquidation maps identify altcoin opportunities.