बिटकॉइन लिक्विडेशन हीटमैप क्या है?
लिक्विडेशन हीटमैप में कीमत लंबवत अक्ष और समय क्षैतिज अक्ष पर होता है।


Heatmap · BTC / USDT
रियल-टाइम BTC तरलता और लिक्विडेशन क्लस्टर्स
कीमत और समय के साथ लिक्विडेशन दबाव को ट्रैक करें, जब लेवरेज्ड पोजीशन बनती, खिसकती और साफ़ होती हैं।
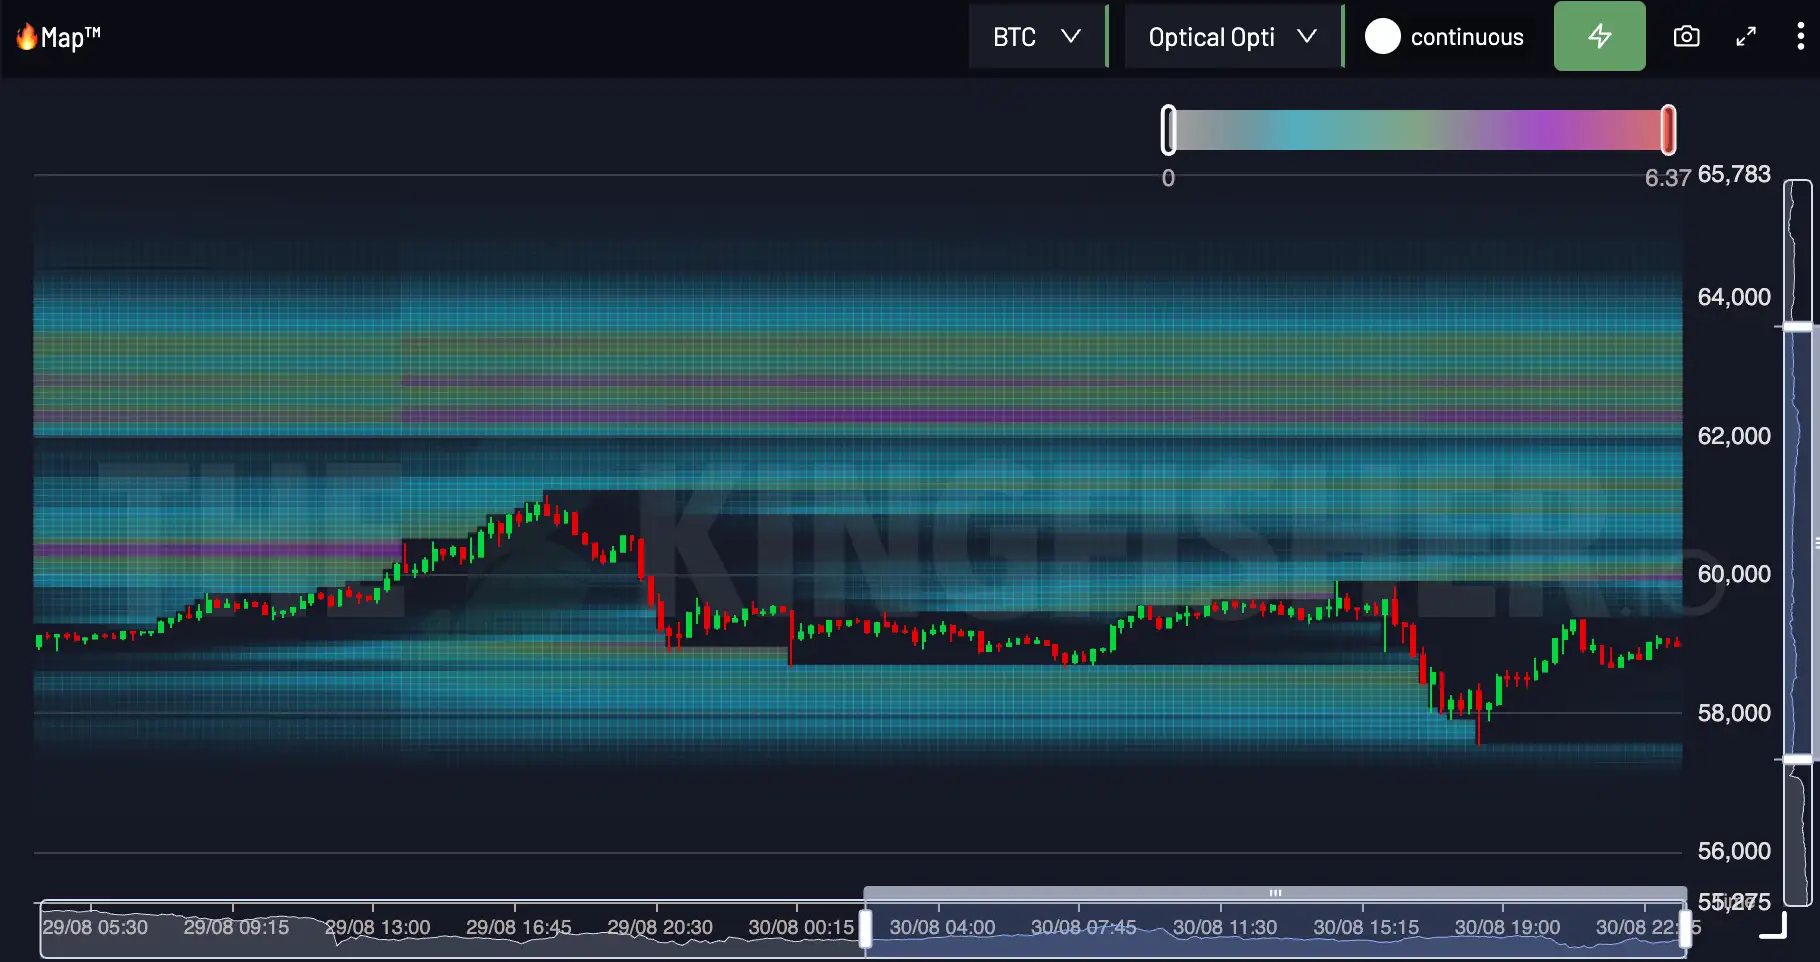
Price × Time
The Kingfisher Heatmap लगातार LiqMap रीडिंग को एक निरंतर दृश्य में जोड़ता है। रंग की तीव्रता प्रमुख ज़ोन और उनके बदलाव को तुरंत दिखाती है।
लिक्विडेशन हीटमैप में कीमत लंबवत अक्ष और समय क्षैतिज अक्ष पर होता है।
मौजूदा कीमत से शुरू करें, ऊपर और नीचे की सबसे चमकीली पट्टियों की तुलना करें और देखें कि दबाव बढ़ रहा है या मिट रहा है।
चमकीली और स्थिर पट्टियाँ दिखाती हैं कि लिक्विडेशन दबाव कहाँ केंद्रित है। पट्टियों का हल्का पड़ना या मिटना दबाव के कम या साफ़ होने को दर्शाता है।
BTC / USDT
The brightest bands on the BTC map mark the price levels holding the most modeled liquidation risk, $73,952 right now. Price gravitates toward these bands because forced orders wait inside them.
A stop placed inside a dense cluster gets swept by the wick that clears the band. Place yours beyond the cluster edge and size the position so that distance costs a fixed fraction of the account.
Check the distance from entry to the nearest heavy cluster before choosing leverage. The calculator below converts that distance into a liquidation price for any leverage tier.
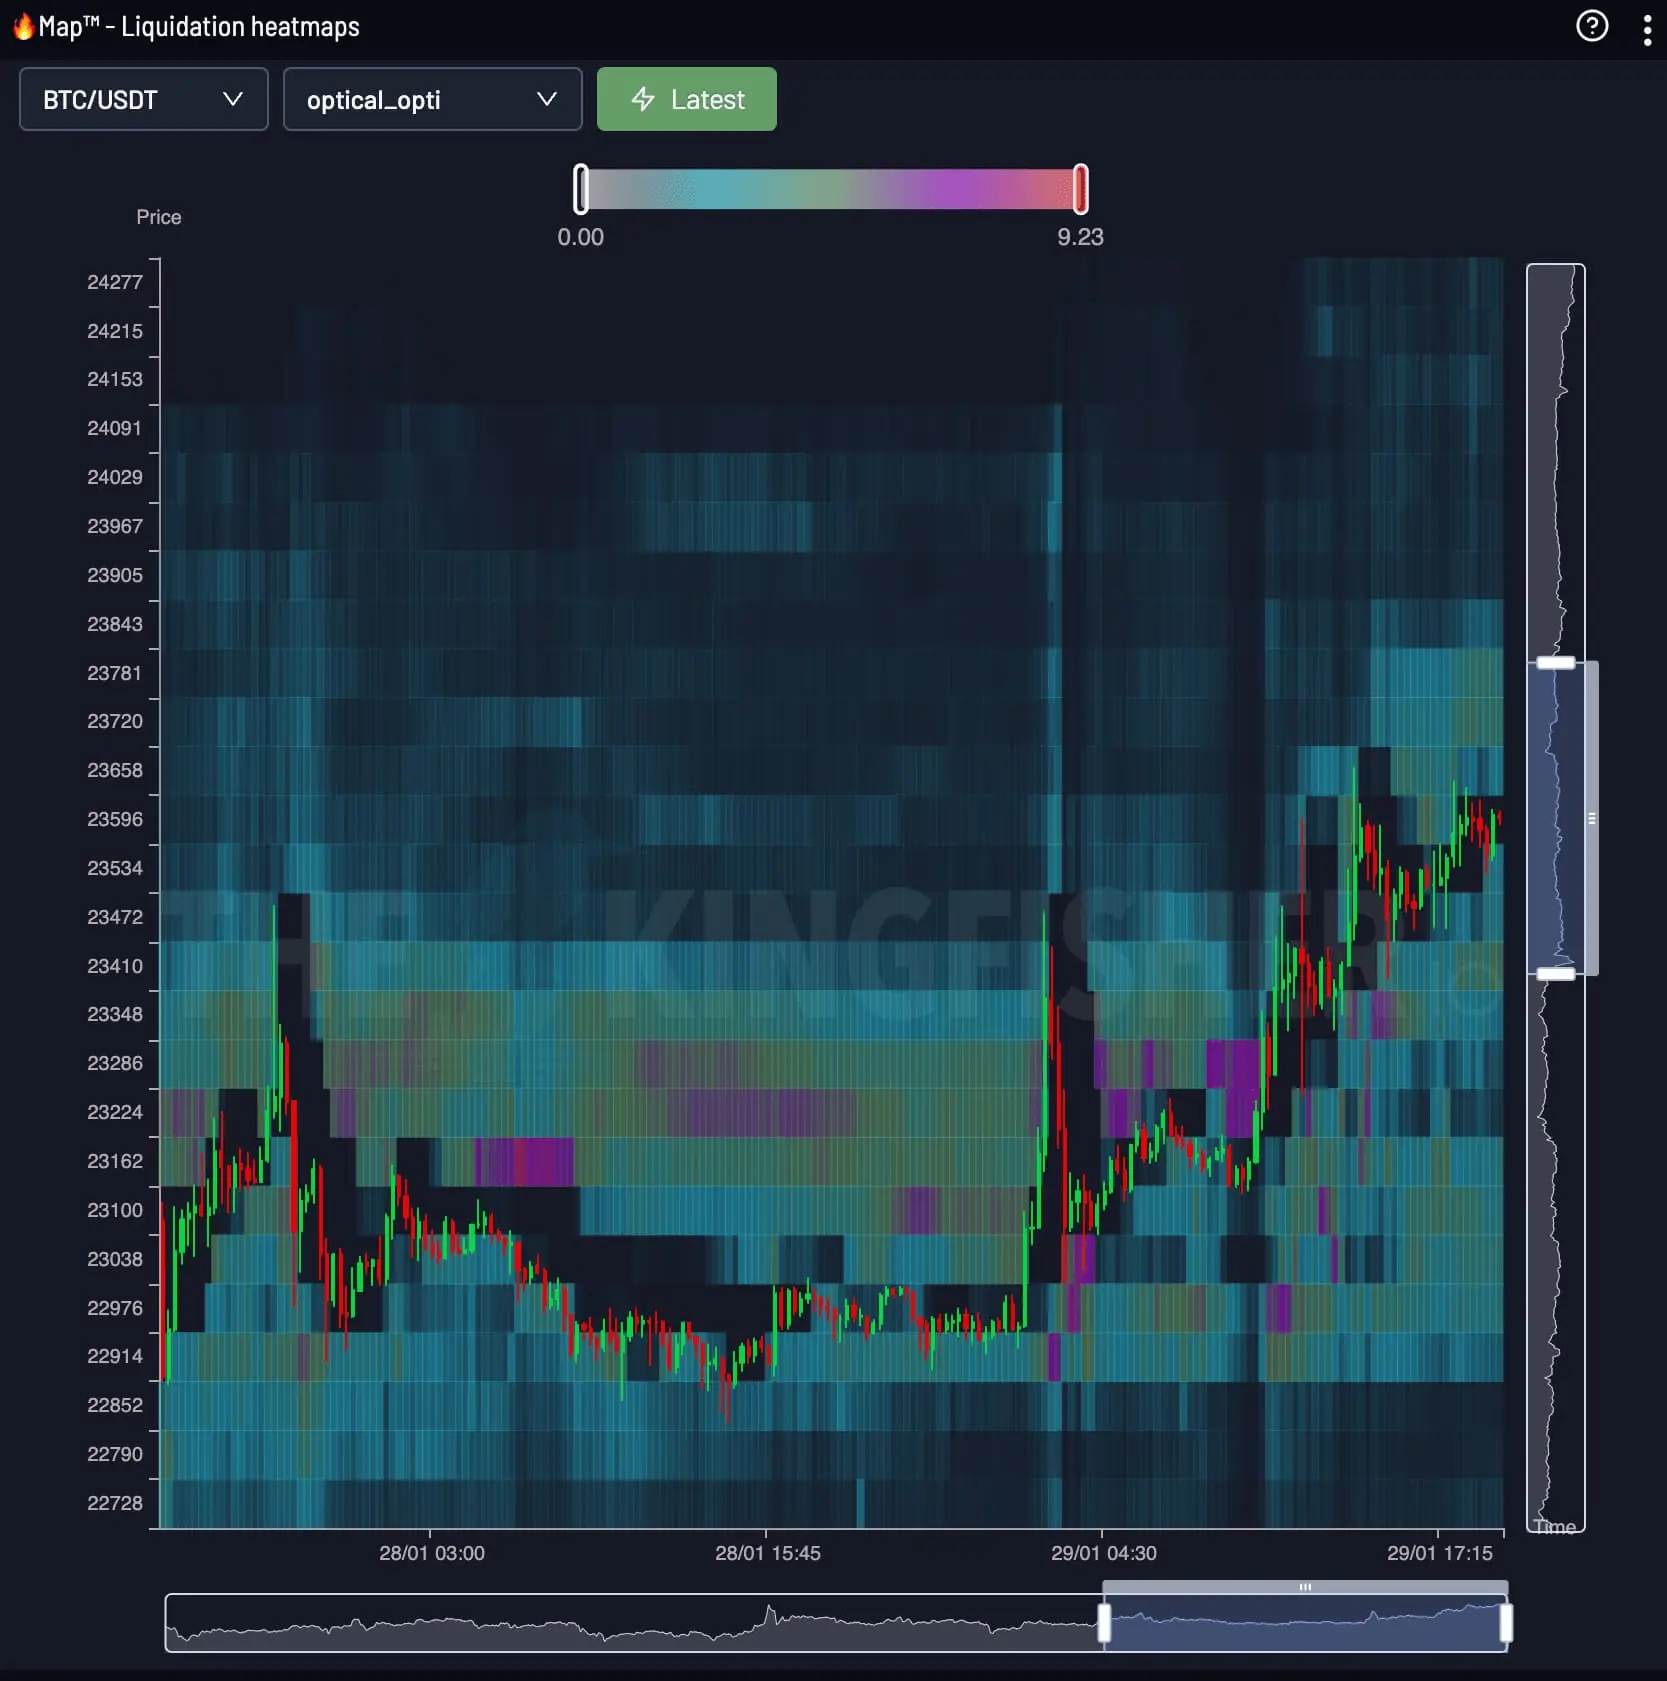
LiqMap / Heatmap
LiqMap किसी एक समय पर कीमत के आसपास लिक्विडेशन संरचना दिखाता है। Heatmap समय-अक्ष जोड़कर दिखाता है कि ये ज़ोन कैसे बनते, खिसकते और साफ़ होते हैं।
| Dimension | BTC Liquidation Map | BTC Liquidity Heatmap |
|---|---|---|
| Shows | Liquidation price levels, tier by tier | Heat intensity of pressure over time |
| Axes | Price x leverage estimate | Price x time (rolling 24h) |
| Answers | Where exact levels and cluster walls sit | When pressure builds toward a level |
| Best use | Placing stops and entries | Timing the test of a level |
Traders read both together: the map gives the level, the heatmap gives the timing. Open the BTC liquidation map view for tier-by-tier levels.
Bitcoin लिक्विडेशन मैपEnter your entry price, leverage and side. The calculator returns your exact BTC liquidation price and position size before you commit margin.
Open the full BTC calculatorThe Kingfisher Terminal
The Kingfisher टर्मिनल में लाइव Heatmap खोलें। Premium एक्सेस में Snapshot और Footprint दृश्य शामिल हैं।
FAQ
बिटकॉइन लिक्विडेशन हीटमैप्स के बारे में आपको जो कुछ भी जानने की आवश्यकता है
ऊर्ध्वाधर अक्ष पर कीमत होती है, क्षैतिज पर समय। मौजूदा कीमत के नीचे के समूह लॉन्ग लिक्विडेशन स्तर हैं, ऊपर के शॉर्ट। बैंड जितना चमकीला, उस कीमत पर उतना अधिक लिक्विडेशन वॉल्यूम इंतज़ार कर रहा है।
लिक्विडेशन मैप लीवरेज के अनुसार स्तर-दर-स्तर लिक्विडेशन कीमतें दिखाता है, जो स्टॉप और एंट्री के लिए उपयोगी है। हीटमैप दिखाता है कि यह दबाव 24 घंटे की विंडो में समय के साथ कहाँ जमा होता है, जो टाइमिंग के लिए उपयोगी है। दोनों साथ पढ़ें: स्तर मैप से, समय हीटमैप से।
लिक्विडेशन मार्केट ऑर्डर बनाते हैं जो क्लस्टर की ओर चाल को बढ़ाते हैं। सघन क्लस्टर चुंबक की तरह काम करते हैं और उनका टूटना झटका तेज कर देता है। मैप जोखिम क्षेत्र दिखाता है, गारंटीड टारगेट नहीं।