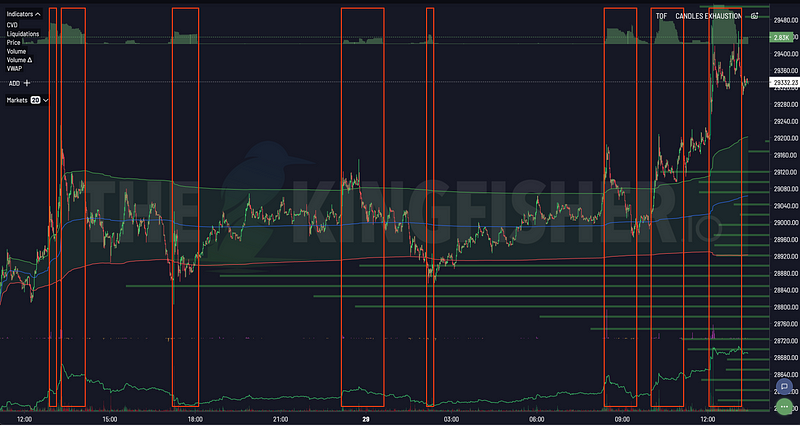


Giriş: Profesyonel Chart Analysis
Teknik analiz kripto trading'de en önemli skill'lerden biri, chart patterns, indicators ve price action reading ile trading decisions'ınizi optimize edebilirsiniz. Kingfisher ile liquidation clusters, professional tools ve data-driven insights kullanarak teknik analiz yeteneklerinizi geliştirebilirsiniz.
Öğrenecekleriniz:
- Teknik analiz temelleri
- Chart patterns识别
- Support/direnç analysis
- Volume analysis
- Kingfisher ile teknik analiz
Market Analysis bu konuyu daha ayrıntılı işliyor.
Triangle sürecin tamamını adım adım anlatıyor.
Canlı Ethereum tasfiye haritası, zorunlu satışların şu an nerede yoğunlaştığını gösterir.
Adx sürecin tamamını adım adım anlatıyor. The Kingfisher Scalping Araç Seti: Kripto Perp Analizi İçin Bir Çerçeve sürecin tamamını adım adım anlatıyor.
Teknik Analiz Temelleri
Core Concepts
Teknik Analiz Nedir?
Definition:
Price action ve volume
Geçmiş data analysis
Gelecek price movement
Prediction attempt

Türkçe:
"Teknik analiz"
"Chart analizi"
"Grafik analizi"

Assumptions:
- Price discounts everything
- Price moves in trends
- History repeats itself
- Markets are psychological
Chart Types:
Candlestick Chart:
Open, high, low, close
Price action detail
Most popular

Line Chart:
Sadece close price
Trend clarity
Less detail

Heikin Ashi:
Trend filtering
Noise reduction
Swing trading için

Kingfisher:
Candlestick default
Multiple types available
Support ve Direnç
Price Levels
Support (Destek):
Definition:
Price level below current
Buying pressure exceeds selling
Price drops, then bounces
Historical significance

Türkçe:
"Destek seviyesi"
"Diyabetleri"

Types:
- Horizontal support
- Trendline support
- Moving average support
- Cluster support (Kingfisher)

Kingfisher Advantage:
Liquidation clusters = major support
Professional level identification
Estimated levels add market context
Resistance (Direnç):
Definition:
Price level above current
Selling pressure exceeds buying
Price rises, then drops
Historical significance

Türkçe:
"Direnç seviyesi"

Types:
- Horizontal resistance
- Trendline resistance
- Moving average resistance
- Cluster resistance (Kingfisher)

Kingfisher:
Short liquidation clusters
Major resistance levels
Professional identification
Role Reversal:
Pattern:
Support becomes resistance
Resistance becomes support
Broken levels flip roles

Trading:
Old support broken → Becomes resistance
Old resistance broken → Becomes support
Kingfisher clusters often these levels
Chart Patterns
Price Formations
Bullish Patterns:
Double Bottom:
W shape formation
Two equal lows
Breakout confirms
Bullish signal

Ascending Triangle:
Flat top, rising bottom
Breakout upward
Bullish continuation

Cup and Handle:
U shape, small pullback
Breakout confirms
Strong bullish

Kingfisher Confirmation:
Patterns at clusters = stronger
Breakout with volume
GEX+ confirms (Pro plan)
Bearish Patterns:
Double Top:
M shape formation
Two equal highs
Breakdown confirms
Bearish signal

Descending Triangle:
Flat bottom, falling top
Breakdown downward
Bearish continuation

Head and Shoulders:
Three peaks, middle highest
Neckline break
Strong bearish

Kingfisher:
Patterns at clusters = stronger
Breakdown with volume
GEX+ confirms
Indicators
Technical Analysis Tools
Moving Averages:
SMA (Simple Moving Average):
Sıralı average
Trend following
Support/direnç

EMA (Exponential Moving Average):
Weighted average
Faster reaction
Trend following

Common Periods:
50 MA: Medium trend
200 MA: Major trend
20 EMA: Short-term

Kingfisher:
MA clusters = major levels
Price at MA = cluster confirmation
RSI (Relative Strength Index):
Momentum Indicator:
0-100 range
Overbought >70
Oversold <30

Usage:
Overbought = potential reversal
Oversold = potential reversal
Divergence trading

Kingfisher:
RSI divergence at clusters
Strong reversal signals
MACD:
Trend Indicator:
MACD line, signal line
Histogram shows momentum
Crossovers signal

Bullish Crossover:
MACD crosses above signal
Buy signal

Bearish Crossover:
MACD crosses below signal
Sell signal

Kingfisher:
MACD at key levels
Confirmation strength
Volume Analysis
Trading Volume
Volume Significance:
High Volume:
Strong conviction
Institutional participation
Trend continuation likely
Breakouts/breakdowns

Low Volume:
Weak conviction
Retail participation
Potential reversal
Range trading

Kingfisher:
Volume at clusters
Cluster strength
Breakout confirmation
Volume Patterns:
Volume Breakout:
Price breaks level
High volume confirms
Real breakout likely

Volume Exhaustion:
Trend continuation
Volume declines
Potential reversal

Volume Divergence:
Price new high/low
Volume doesn't confirm
Reversal warning
Sonraki adım Volume Profile: How Traders Read Volume at Every Price Level içinde açıklanıyor.
Kingfisher ile Teknik Analiz
Professional Edge
Liquidation Clusters = Levels:
Traditional Technical:
Support/resistance based on
Historical price points
Visual patterns

Kingfisher Advantage:
Liquidation clusters show
ACTUAL support/resistance
Where stop losses are
Where traders trapped

Integration:
Technical analysis +
Kingfisher clusters =
Superior analysis
GEX+ Confirmation (Pro Plan):
Technical Pattern:
Double bottom forming
Bullish signal

GEX+ Confirmation:
Positive GEX at support
Dealers long gamma
Stronger support
Higher probability

Combined:
Technical + GEX+
Best signals
Additional market context
Multi-Timeframe Analysis: Kingfisher Kullanım Profilleri: Farklı Trader Stilleri için İş Akışları bu konuyu daha ayrıntılı işliyor.
Process:
1. Weekly trend analysis
2. Daily setup identification
3. 4H entry timing
4. Kingfisher all timeframes

Alignment:
Weekly + Daily + 4H
All aligned = best setup
Kingfisher clusters
All timeframes confirm
Pratik Teknik Analiz
Sample Analysis
BTC Technical Analysis:
Weekly Chart:
Uptrend intact
Higher highs, higher lows
50 MA above 200 MA

Daily Chart:
Pullback to support
$94,000 cluster (Kingfisher)
Double bottom forming
Bullish divergence

4H Chart:
RSI oversold
Volume declining
Reversal signal

Kingfisher:
Major cluster at $94,000
GEX+ positive (Pro)
Multi-timeframe bullish

Setup:
Long entry at $94,200
Stop at $93,800
Target $96,000
Yaygın Hatalar
Technical Analysis Pitfalls
Hata 1: Analysis Paralysis
Problem:
Too many indicators
Conflicting signals
No clear decision
Analysis forever

Çözüm:
3-5 indicators max
Focus on price action
Kingfisher clusters primary
Keep it simple
Hata 2: Ignoring Kingfisher
Problem:
Technical analysis only
Cluster levels ignore
Weaker signals
Less market context

Çözüm:
Technical + Kingfisher
Clusters = real levels
Professional approach
More market context
Hata 3: No Multi-Timeframe
Problem:
Sadece daily chart
4H conflicting
Bad entries

Çözüm:
Always multi-timeframe
Weekly + Daily + 4H
Kingfisher all charts
Aligned = best
Sonuç
Technical Analysis with Kingfisher
Teknik analiz skill + Kingfisher tools = edge.
Avantajlar:
- Liquidation Clusters, Real levels
- GEX+, Dealer confirmation (Pro)
- Multi-Timeframe, Best analysis
- Volume Data, Confirmation
- Liquidation Clusters, Estimated price levels
Success Formula:
- Learn technical basics
- Add Kingfisher clusters
- Multi-timeframe analysis
- Practice consistently
- Keep it simple
Professional Analysis, Professional Results →