
Options Skew Templates for Perp Traders: Complete Guide to Using Skew Data on Kingfisher
Why Perp Traders Need to Understand Options Skew
Here is something most perpetual futures traders get wrong: they ignore the options market entirely. "I trade perps, not options," they say. "What do I care about IV or gamma?"
Here is why you should care: the options market is where smart money positions for volatility. Market makers, institutions, and large proprietary trading firms use options to hedge their perp exposure. Their positioning in options directly impacts how they trade in perps. When dealers are short gamma, they sell into rallies and buy dips -- suppressing volatility. When they are long gamma, they do the opposite -- amplifying moves.
The skew data available through Kingfisher's template system (originally developed by 52kSkew and now integrated into the KF platform) gives you a window into this institutional flow. You do not need to trade options yourself to profit from knowing what options traders are doing.
This guide breaks down every template type, what each indicator means for your perp trading, and how to combine skew data with liquidation maps for setups that have genuine edge.
The Template Ecosystem: Overview
Kingfisher offers four main skew template categories, each designed for a specific analytical purpose:
| Template | Best For | Skill Level | Key Indicators |
|---|---|---|---|
| Skew Basic | Trend + flow confirmation | Beginner-Intermediate | EMAs, CLD, Buy/Sell Volume, CVDs, Volume Extreme |
| Skew Vanilla | Exchange-specific microstructure | Intermediate | Perp/Spot CVD comparison, Delta line, Exchange premiums |
| Skew Premium | Institutional flow tracking | Advanced | Multi-exchange screener, OTC detection, Premium spreads |
| BTC Compact | All-in-one market overview | All levels | Tape data, CVD panel, Liquidation panel, Spread analysis |
Each template is available at alpha.thekingfisher.io and can be overlaid with Kingfisher's LiqMap data for combined analysis.
Skew Basic: The Foundation Template
What It Does
Skew Basic combines familiar trend-following tools with Kingfisher's unique flow indicators. The goal is to give you a single chart that shows both WHERE price might go (trend tools) and WHY it might go there (flow data).
Core Components:
Ichimoku Cloud + Bollinger Bands + EMAs: Standard trend framework. Use these for directional bias. Price above cloud = bullish structure. Price below cloud = bearish structure. Bollinger Bands show volatility compression/expansion cycles.
VWAPs (Volume Weighted Average Price): Institutional anchor levels. Price above VWAP = bullish intraday momentum. Price below VWAP = bearish. Reversions to VWAP are high-probatility scalps.
CLD (Cumulative Liquidation Delta) -- The Secret Weapon

The top panel of Skew Basic shows CLD, one of the most underappreciated indicators in crypto trading.
How CLD works: It tracks the cumulative sum of long versus short liquidations over time.
- Red bars = Long liquidations (longs getting wrecked, bearish pressure)
- Green bars = Short liquidations (shorts getting squeezed, bullish pressure)
What CLD tells perp traders:
- Areas of offside position buildup. When CLD stacks red bars in one zone, it means longs keep getting liquidated there. That zone is supply. When green bars stack, shorts keep getting squeezed there. That zone is demand.
- Exhaustion signals. If CLD bars are shrinking in size even as price continues moving in that direction, the liquidation fuel is running out. Reversal likely.
- Confirmation for LiqMap entries. When LiqMap shows a cluster and CLD confirms historical liquidation activity at that exact level, your confidence in the setup multiplies.
Practical example: During the Omicron-driven dip in late 2021, $BTC swept into lows driven by spot selling. CLD showed a massive red bar spike (long liquidation event) right at the sweep low. This was exactly where large market players wanted to fill long positions -- efficient entry for 8-9 figure size because the liquidation cascade provided the liquidity. CLD flagged the zone. Smart money bought the liquidation. Price reversed hard.

Buy vs Sell Volume Indicator

This panel shows buying pressure versus selling pressure on every candle, plus whether volume is increasing or decreasing (indicating passive order presence).
Key patterns:
- White box / White arrow on chart: Distribution starting. Buyers disappearing. Passive sellers absorbing but not aggressively pushing lower yet.
- Red arrow: Seller domination accelerates. Trend change imminent. Leads to seller climax (long liquidation event).
- Price makes lower low but selling volume does NOT increase: This is absorption. Someone is eating every sell order. Reversion setup forming.
- Green line divergence from price: Classic trend change signal. Price lower, volume pattern higher = buyers accumulating on weakness.

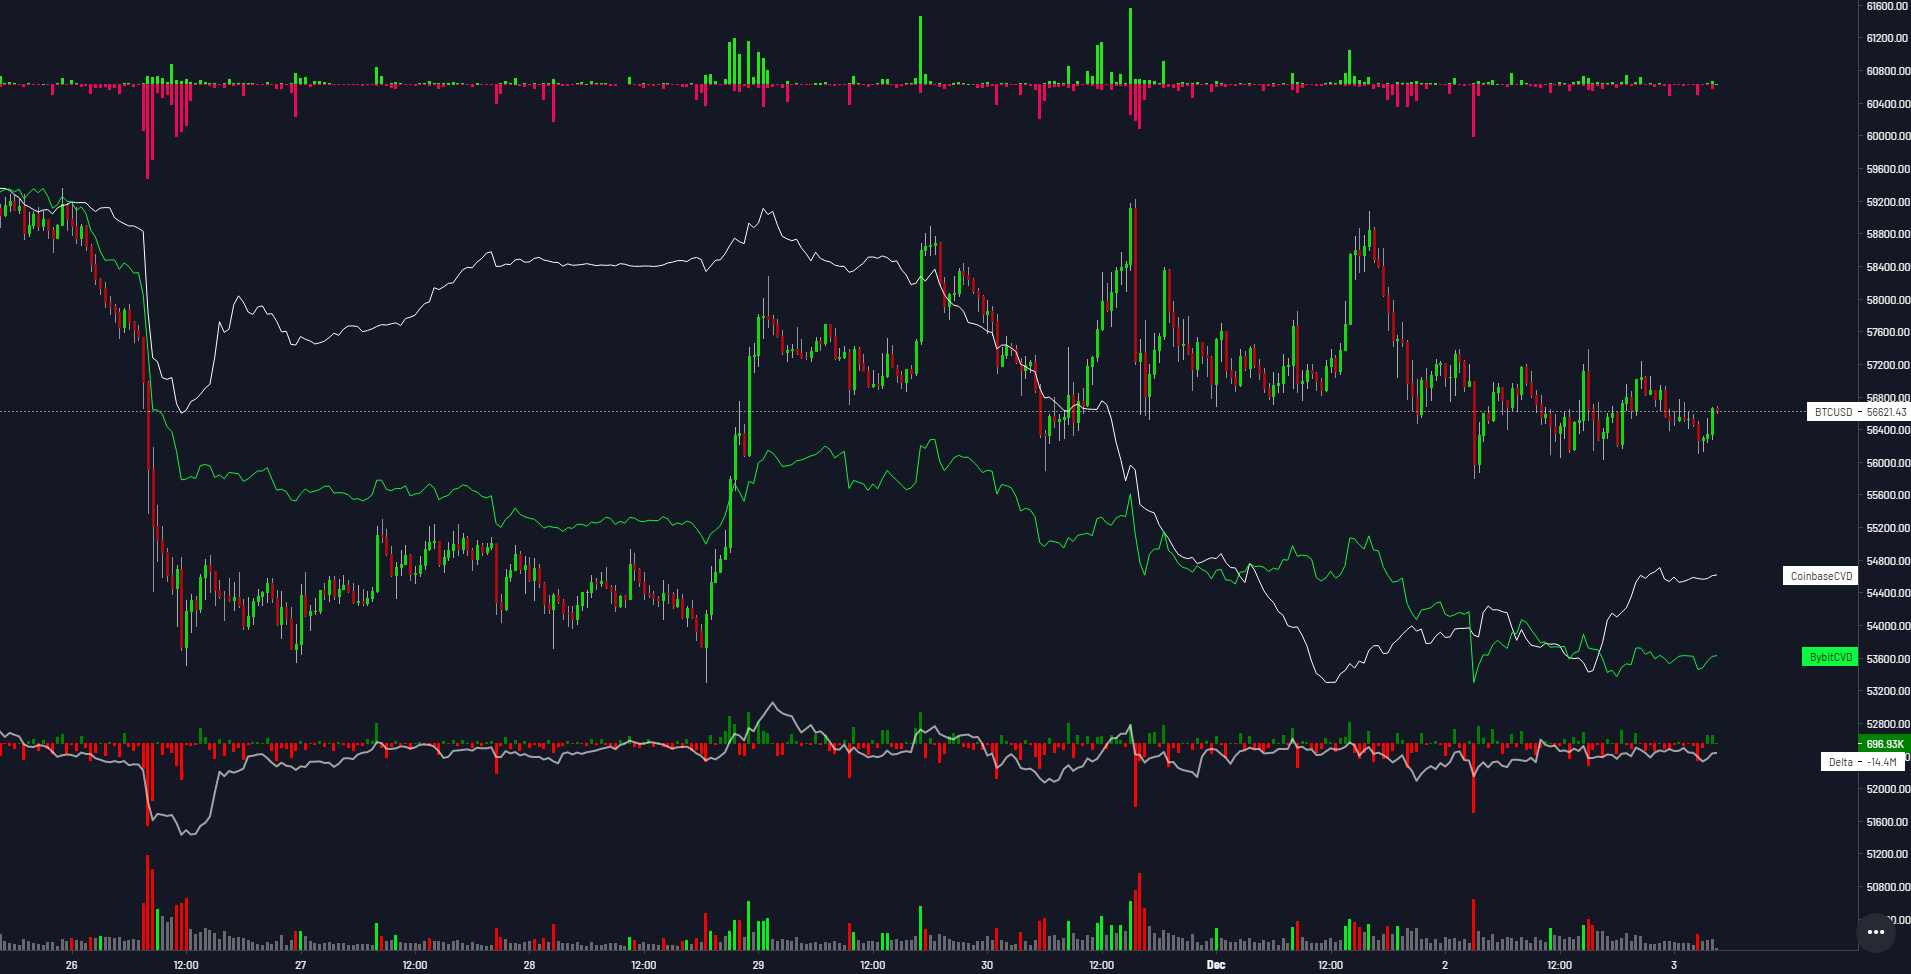
CVDs (Cumulative Volume Delta)

CVDs identify trend changes before price structure reflects them. This is your early warning system.
How to read CVD on Skew Basic:
- Spot CVD (yellow/white line): What Coinbase (and by proxy, institutional spot) is doing
- Perp CVD (blue line): What perpetual futures traders are doing
- Divergence between the two: Gold mine for perp traders
The Spot/Perp CVD Divergence Play:
When spot CVD shows selling pressure (flat or declining) but perp CVD shows aggressive buying (rising), perp traders are bidding up the futures contract while spot sells off. This is either:
- Arbitrage activity (neutral, usually resolves quickly)
- Leveraged FOMO (perp traders chasing, often precedes a correction)
- Accumulation play (smart perp money front-running spot recovery)
Context matters. Check TOF and funding rate to determine which scenario is playing out.
Volume Extreme (Filtered Taker Volume)

This indicator highlights volumetric outliers based on a rolling lookback period (default: previous 50 candles).
- Green bar: Buying volume significantly above average
- Red bar: Selling volume significantly above average
- Grey bar: Normal volume
How to use it for perp trades:
- Volume extreme in direction of trend = trend confirmation (add to position or hold)
- Volume extreme against trend = potential reversal (prepare to fade)
- Combine with CVD and CLD for confluence before acting


Skew Vanilla: Exchange-Specific Microstructure
What It Does
Skew Vanilla templates are built for traders who want exchange-level granularity. Each template pairs a specific perpetual futures exchange with its reference spot exchange:
| Perp Exchange | Spot Reference |
|---|---|
| Bybit Perp | Coinbase |
| Binance Futures | Binance Spot |
| Deribit | Coinbase |
| Bitfinex Perp | Bitfinex Spot |
Why this pairing matters: The spread between perp and spot prices (the basis/funding premium) tells you everything about leverage sentiment. When perps trade at a significant premium to spot, longs are aggressive and paying through the nose via funding. When perps trade at a discount, shorts are dominant.


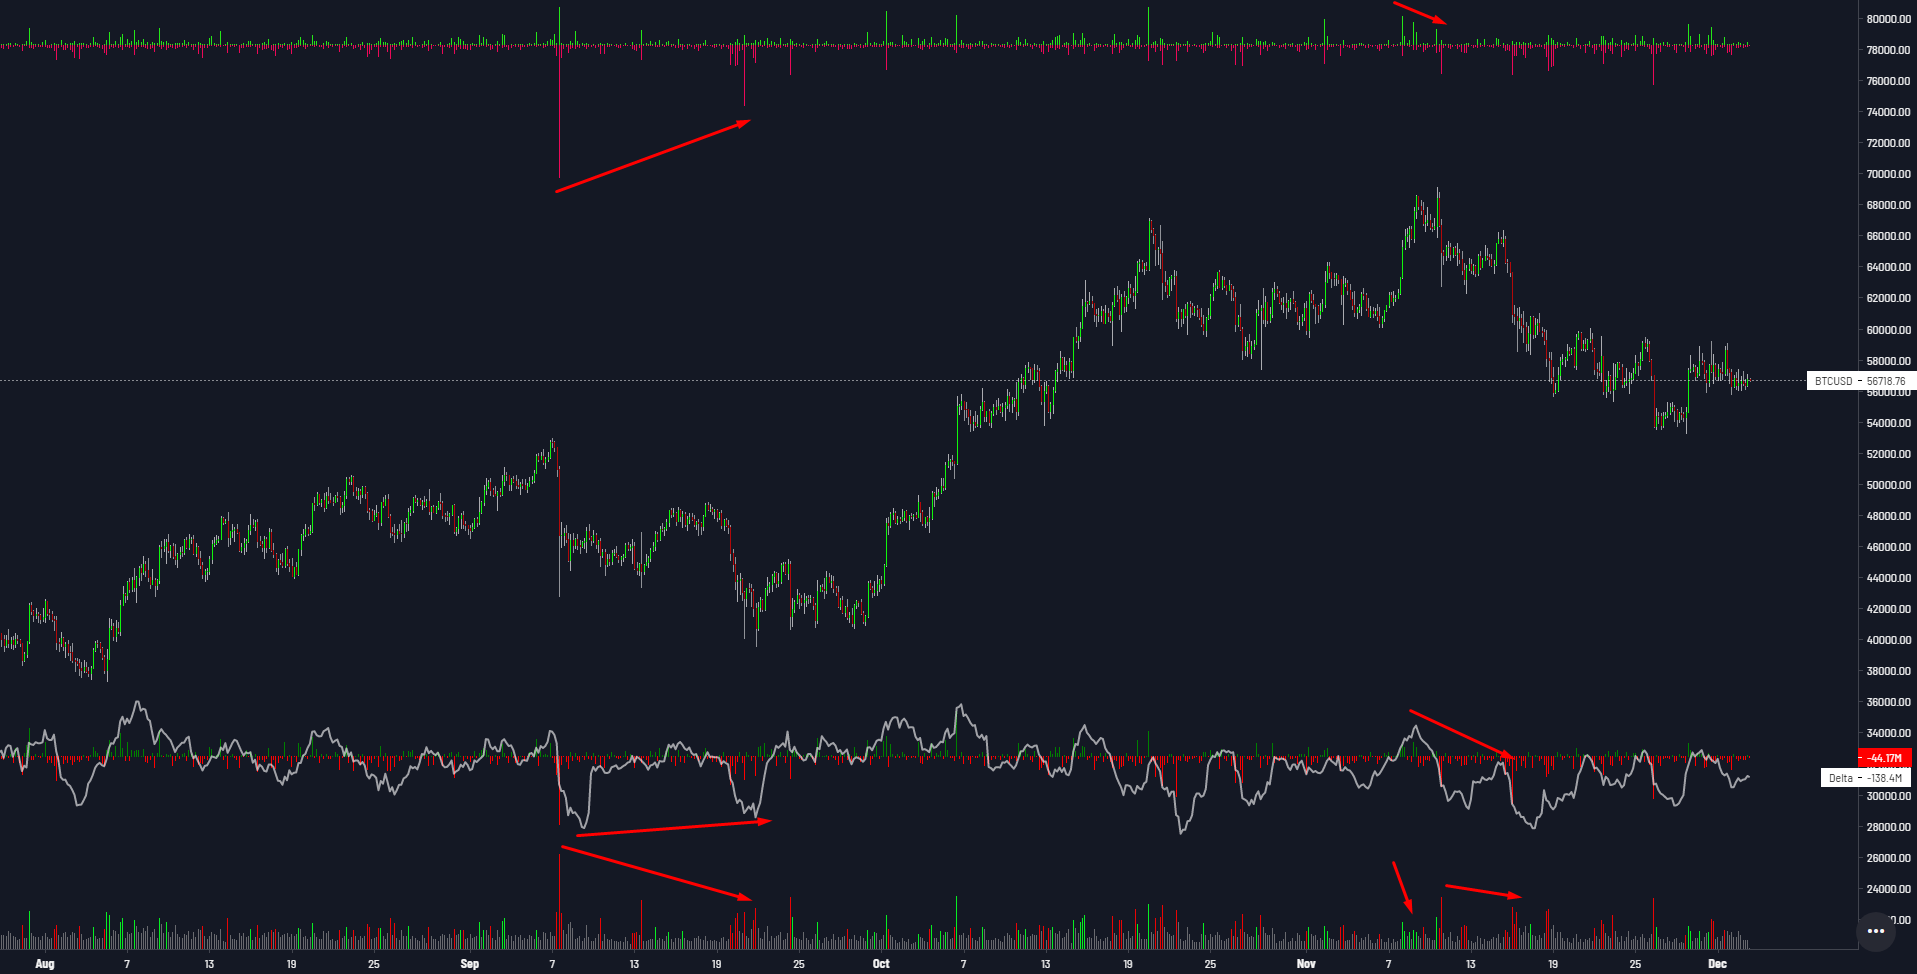
The Delta Line

The white Delta line on Skew Vanilla measures cumulative delta divergences against price. This is your mean-reversion and divergence detection tool.
Delta line use cases:
- Mean reversion divergences: Delta diverges bullishly while price drops = buy signal near support
- Market-defined resistance: Delta shows selling exhaustion at resistance aligned with spot CVD distribution
- Top/bottom detection: Delta making lower highs while price makes higher highs = distribution in progress

Buy vs Sell Flow with Delta Confluence

When Buy vs Sell flow indicator shows divergence AND the Delta line confirms it, you have a high-probability reversion setup.
Seller climax pattern (long entry signal):
- Price drops sharply (panic selling visible)
- Buy vs Sell flow shows maximum selling intensity
- Delta line shows bullish divergence (less selling participation than price suggests)
- CVD shows absorption (spot or perp buyers eating the sells)
- Enter long at the climax low
- Target: VWAP return or nearest short cluster
This same pattern works inverted for buyer climaxes (short entry signals). On 4-hour timeframes, these patterns identify distribution and accumulation phases across multiple sessions.


Skew Premium: Tracking Institutional Flow
What It Does
Skew Premium templates are designed for one purpose: seeing when OTC desks and institutional players are entering or exiting the market. This is the deepest level of analysis available in the template ecosystem.
BTC Market Screener

The Premium screener shows per-exchange breakdown of:
- Each exchange's individual CVD
- Volume Delta by exchange
- Premium vs Spot (perp pricing relative to spot)
- Ask-Bid spread differential
- Liquidation activity per exchange
How to use this for perp trading: When one exchange shows dramatically different CVD or premium behavior than others, something is happening on that specific venue. A large player might be accumulating or distributing primarily on one exchange. Front-running this flow (or at least being aware of it) prevents you from getting run over by their orders.
BTC Perp vs Spot Premium + Market CVDs

This template identifies clean trends by showing when perp traders are chasing price into spot market maker territory.
Color coding:
- Red area: Perps trading ABOVE spot price (premium = longs paying)
- Green area: Perps trading BELOW spot price (discount = shorts paying)
Trading implication: When perp premiums expand rapidly (red area growing), longs are getting aggressive. This often precedes either:
- A squeeze (if shorts cannot handle the premium cost)
- A correction (if the premium becomes unsustainable and longs unwind)
Watch for premium contraction as your signal that the leveraged crowd is losing conviction.
BTC Compact: The All-in-One Overview

What It Does
BTC Compact combines tape data, volume delta, CVDs, and liquidation information into a single comprehensive view. It is the best template for traders who want to see the whole picture without switching between multiple charts.
Main Chart Components:
- Volume Delta: Net buying (green) vs net selling (red) momentum
- 3 Tape Panels: Spot tape, Perp tape, Futures tape -- showing who is aggressing at each price level
- Liquidation & Spread Panel: Green = short liquidations, Purple = long liquidations. White dotted line = spread width (narrow spread = high volatility probability)
CVDs Panel:
- Spot aggregate CVD
- Binance Spot CVD
- Binance Futures CVD
- Perp aggregate CVD
How to read the full picture:
- Check tape panels for aggression direction (who is hitting bids/offers?)
- Cross-reference with CVDs (is this aggression changing the cumulative position?)
- Check liquidation panel (are liquidations confirming or contradicting the move?)
- Note spread behavior (widening spread = increasing imbalance = volatility incoming)
Combining Skew Templates With LiqMap Confirmation
This is where the real magic happens. Skew templates tell you about flow, momentum, and participant behavior. LiqMaps tell you about price targets defined by liquidation clusters. Together, they create complete trade setups.
Setup 1: Skew Basic CLD + LiqMap Cluster Target
Logic:
- Skew Basic CLD shows historical long liquidation concentration at a specific price level
- LiqMap confirms a current long cluster exists at or near that same level
- Both independent data sources agree: this price level has been and will be a liquidation zone
- Enter short with target at the cluster, stop above recent structure
Why it works: Historical CLD proves the level attracts liquidations. Current LiqMap proves the fuel is there NOW. Double confirmation from unrelated data sources.
Setup 2: Skew Vanilla Delta Divergence + LiqMap Sweep Entry
Logic:
- Skew Vanilla Delta line shows bullish divergence (price dropping, delta improving)
- LiqMap shows short cluster above current price within reach
- Funding rate is moderate-to-negative (shorts paying, adding squeeze fuel)
- Enter long targeting the short cluster sweep
Why it works: Delta divergence says "selling is exhausting." LiqMap says "there is fuel above for a squeeze." Combined thesis: price will revert upward into the cluster.
Setup 3: Skew Premium Exchange Divergence + LiqMap Directional Bias
Logic:
- Skew Premium shows Binance perp CVD rising aggressively while Bybit perp CVD flat
- Binance-specific flow is driving the market
- LiqMap on Binance shows clean cluster setup in CVD direction
- Trade the Binance-driven setup with higher confidence
Why it works: Not all exchanges move in lock step. Identifying which exchange is leading flow lets you trade with the driver rather than getting whipsawed by lagging venues.
Which Template Should You Start With?
If you are new to flow analysis: Start with Skew Basic. It has the gentlest learning curve and includes all the essential indicators (CLD, CVD, Volume) alongside familiar trend tools (EMAs, Bollinger Bands).
If you are an active day trader: Move to Skew Vanilla once you understand Basic. The exchange-specific CVD comparisons and Delta line give you the precision needed for intraday setups.
If you trade larger size or want institutional context: Skew Premium is worth the learning investment. The multi-exchange screener and premium analysis reveal flows that never show up on basic charts.
If you want one chart that shows everything: BTC Compact is your answer. It sacrifices some depth for breadth, giving you a command-center view of the entire market on a single screen.
Pro tip: Basic and Vanilla templates are free every weekend on alpha.thekingfisher.io. Use weekends to practice and learn without subscription cost. For full weekday access with real-time data, see our pricing plans.
Final Notes on Using Skew Data Effectively
Do not overload your chart. Pick ONE primary template and master it before adding others. Three templates open simultaneously with LiqMap overlay creates analysis paralysis, not clarity.
Do remember that skew data is complementary, not replacement. Skew templates tell you about flow and participant behavior. They do NOT tell you where liquidation clusters sit. For that, you need LiqMap. Use them together.
Do backtest your template-based strategies. Every pattern described in this guide has historical precedent, but not every instance produces a winning trade. Review your template trades weekly and refine which patterns work best for your style.
Do not ignore the timeframe match. Skew Basic on a 1-minute chart looks very different from Skew Basic on a 4-hour chart. Match your template timeframe to your trading timeframe.
Related reading: Deepen your flow analysis with our CVD trading guide, understand the liquidation side with LiqMap fundamentals, or explore Toxic Order Flow for additional timing signals that pair perfectly with skew data.
Related Articles
- GEX, Gamma, Vanna and IV Explained for Perp Traders: Practical Guide to Kingfisher GEX+
- How to Read Crypto Charts: Complete Beginner's Guide
- V-Charting Complete Guide: Master Volume Analysis for Crypto Trading
- Exhaustion Candles: How to Spot Reversal Signals Before Price Turns
Templates are just maps. The territory is the market. Learn to read both.
FAQ
Q: Which Skew template should I start with if I am new to flow analysis? A: Start with Skew Basic. It combines familiar trend tools (Ichimoku Cloud, EMAs, Bollinger Bands) with Kingfisher's core flow indicators (CLD, CVD, Volume Extreme), giving you a gentle on-ramp into reading order flow. Master Basic for 2-3 weeks before touching Vanilla or Premium. Most traders who jump straight to Premium get overwhelmed by the data density and abandon flow analysis entirely. Build the foundation first.
Q: Can I use Skew templates without a paid Kingfisher subscription? A: Yes -- Basic and Vanilla templates are free every weekend on alpha.thekingfisher.io. Use weekends to practice reading CLD patterns, spot/perp CVD divergences, and volume extreme signals without paying anything. For weekday trading with real-time data during market hours, you need a Pro ($79/month) or Elite ($109/month) subscription since delayed data is not actionable for intraday setups.
Q: What is the difference between CVD on Skew templates versus Kingfisher's native CVD tool? A: Skew template CVDs (developed by 52kSkew) show spot versus perp CVD side-by-side with exchange-specific breakdowns and visual divergence detection built in. Kingfisher's native CVD tool provides deeper integration with LiqMap and TOF data on the same chart. They use the same underlying data but present it differently -- Skew templates excel at comparative analysis across exchanges, while native KF CVD is better for combining volume confirmation with liquidation cluster targeting.
Q: How do I know if a CLD signal is reliable or just noise? A: Look at three things: bar size relative to recent average (a spike 3x+ normal size is significant), consistency (multiple bars stacking in the same direction at the same price level shows sustained liquidation activity), and confluence with other indicators (CLD long-liquidation spike at the same level where LiqMap shows a current cluster is your highest-probability setup). A single isolated CLD bar without cluster confirmation is worth watching but not trading.
Q: Should I run multiple Skew templates simultaneously? A: No -- that is a fast path to analysis paralysis. Pick one primary template that matches your trading style (Basic for trend+flow, Vanilla for exchange microstructure, Premium for institutional context) and master it. You can toggle a second template for confirmation on specific setups, but running three or more at once splits your attention and degrades decision quality. One template used well beats five templates used poorly.
Transform Your Crypto Strategy
Harness The Power of The Kingfisher's Comprehensive Market Intelligence!
Glossary
Learn key terms and concepts from our comprehensive crypto trading glossary.
Browse Glossary →Related Articles

Getting Started on The Kingfisher: Stop Being Exit Liquidity
What problem does Kingfisher solve? See how liquidation maps reveal where price will go BEFORE it moves there. Stop getting hunted by whales. Start trading with an edge in 10 minutes.

Options Skew Templates for Perp Traders: Complete Guide to Using Skew Data on Kingfisher
Master options skew data for perpetual futures trading. Learn how to read and use Skew templates on Kingfisher, understand different template types (Basic, Vanilla, Premium), when each template works best, and how to combine skew analysis with LiqMap confirmation for high-probability crypto trading setups.

Toxic Order Flow Bitcoin: Detect Market Manipulation in Real-Time
Stop being exit liquidity. Learn how toxic order flow (TOF) reveals when whales are hunting retail traders. Practical guide with step-by-step interpretation and trading strategies.
How to Detect Crypto Market Manipulation in Real-Time
Stop being played by whales. Learn to spot crypto manipulation before it costs you money using Kingfisher's Toxic Order Flow and liquidation data. Real examples included.