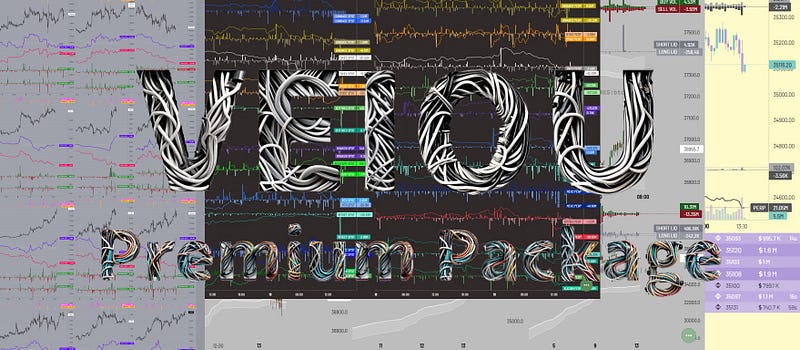
The Good (in)Side — Premium Package by VEIOU
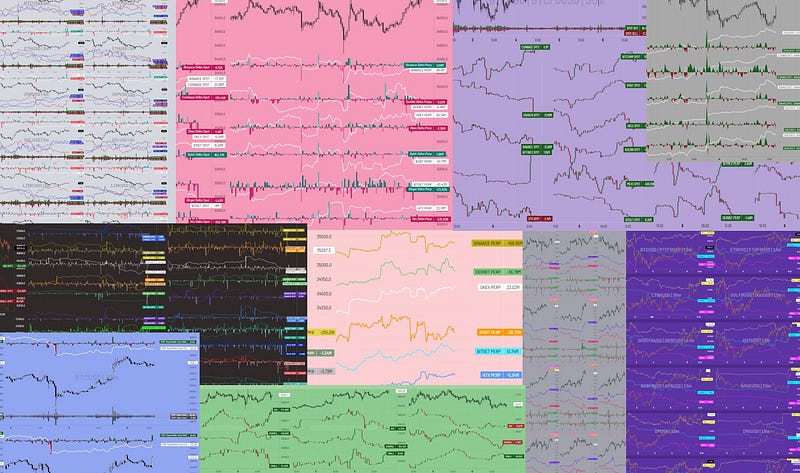
This package doesn’t just show you the price chart, it gives you insight into the market.
The Good (in)Side — Premium Package by VEIOU
This package doesn’t just show you the price chart, it gives you insight into the market.
By clearly comparing Spot and Perp data, see where there is manipulation, where the price is suppressed, which games are going on in which exchanges, and where the big players are taking action.
This package includes data and dashboards that will give you insight into the markets. The aesthetics data will always keep you in the game and you will be the secret inner source of the markets.
The one package that quarterbacks don’t want.
Get it now.
Read on to learn more about the package.
What does this package do?
This comprehensive package takes you not only to the surface of the financial markets but also to their depths, allowing you to manage your investments more consciously.
It not only shows price charts but also lets you understand what’s going on in the market by comparing spot and perp data. It provides a powerful analytical tool to track manipulation, identify points of price pressure, and understand the strategies of major players.
This package includes dashboards enriched with powerful data, keeping you on the pulse of the market at all times. By solving the games in the market and understanding what kind of movements occur in which exchanges, you can manage your investments more safely and strategically. You will gain an advantage by using this package equipped with data that game makers do not want, on your path to financial success.
Now, get this unique package to get ahead in the financial markets and make more informed decisions. Be the secret inner source of the market, seize the opportunities, and achieve success by seizing the opportunities within the game. This package is an indispensable tool for investors and traders and allows you to stand out in the financial world. Act now and change the rules of the game!
Become an Expert in Spot and Perp Data
A comprehensive, powerful, well-ordered template that deciphers cryptocurrency exchanges, tracks them and shows what’s going on inside the exchange is waiting for you in this package.
Discover the inside scoop on Bitcoin, Ethereum, and Solana coins. Trace the manipulations between Spot and Perp and the secret games played by the market makers. See the high candles with delta data and understand the direction with CVD data. Understand whether the rise is fake by coming with the leverage side or whether the rise is real with support by coming to spot buying. This template has a lot to tell you. Get instant data in all periods by owning this package. Let it take your trading to another level. Now let’s examine the examples below for this template.
Ethereum Analysis
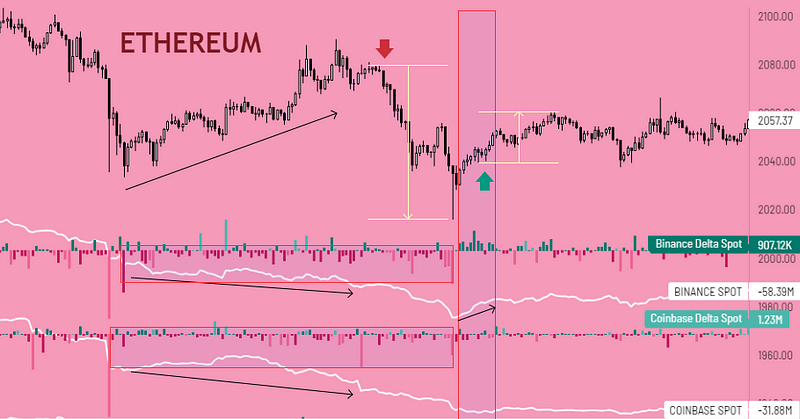
Our coin is Ethereum, let‘s look at the data. After the sharp decline, the coin started to rise. We want to understand whether this rise is fake or not. And there is something that attracts our attention. Binance and Coinbase exchanges continue spot sales despite the coin’s rise. So we understand that the rise is caused by leverage. And as can be seen, the price begins to retreat rapidly after receiving liquidity. If you lost money by falling for this rise, this template will tell you the truth.
Bitcoin Analysis
Now let’s look at Bitcoin. Do you say that the markets are boring, they always go horizontal, and you don’t understand anything? This package will tell you a lot. In charts that are stuck within a certain range and move horizontally, the inner face of the market whispers to us the voice of the upcoming movement. The spot side of Bitcoin, which is stuck in a range, is in a downward trend. The price is within a certain range and there are spot sales. We can see that after the secret spot sales of the Binance exchange, there were sharp sales and the price fell. This package will prevent you from being left behind and falling for manipulations.
Solana Analysis
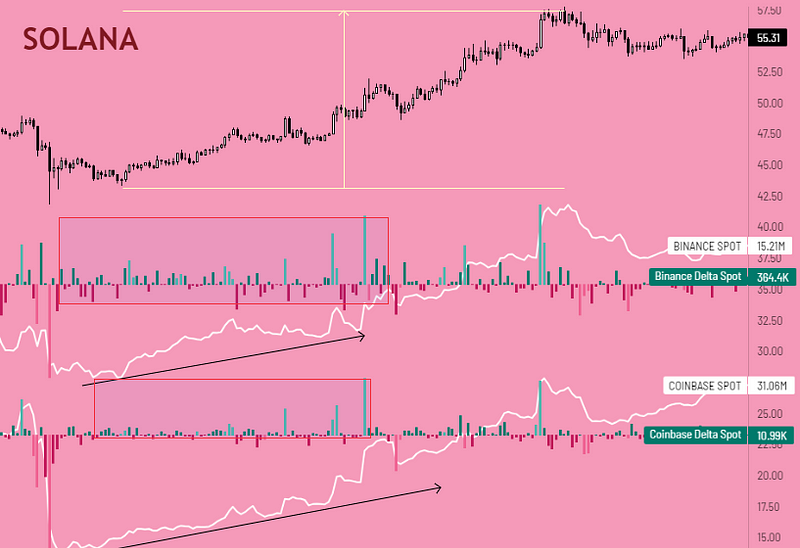
Now we will look at the Solana coin. The price continues to rise calmly and slowly. You are thinking of going long. But You are worried that the price has gone too high. It will suddenly crash. And you give up entering long. Well, if you looked at the inside of the market, you would see spot purchases seen by Binance and Coinbase exchanges. Why should spot buyers on these exchanges buy high? This means we will rise even higher. If a coin with this strong spot buying tendency starts to fall, you can understand that this is manipulation with the perp. You will be able to see the manipulation from the perp data next to the spot data. Thanks to the package, it has never been easier to watch the games in the exchanges. This template will give you more than just data. It will verify your transaction confirmations and keep your trading psychology healthy as well.
Take Complete Control Over BTC, ETH, and SOL Coins. More Coins Coming Soon In This Package
Get to Know the Templates Special for You
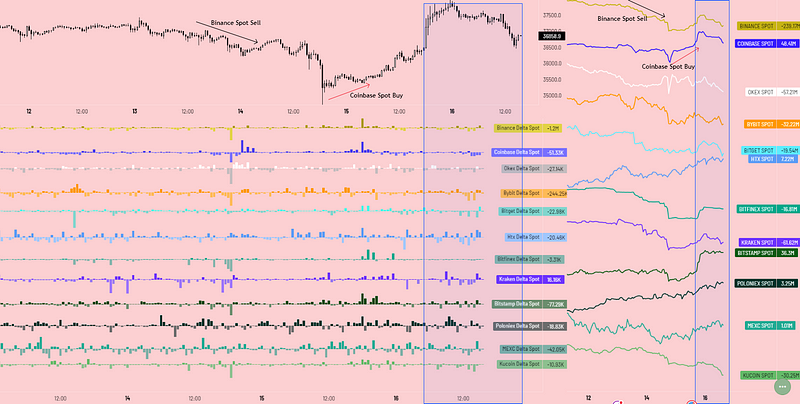
Why you should be careful about spot purchases? This is quite clear. Spot purchases are the source of increases. Perp is a method that suppresses the price and manipulates it. Why don’t you have a Bitcoin Spot Dashboard with many exchanges? Understand the power of Spot Buying that shapes the markets and have full insight into the market. Markets sometimes fall so hard that you think the direction is further down. No, this is entirely a money war between you and the markets. If you are buying high and selling low because you are afraid, I recommend the path shown by this package. You can understand by looking at spot data that will tell you where you should buy and where you should sell. The price remains where it is, but are you seeing spot sales on the Binance side? This is the best sign that we are in the accumulation phase and the next phase may be a downward distribution. Buying and selling thus make the first profitable move in their game plan during the accumulation period. Are you seeing spot purchases from exchanges? Are you seeing spot sales from exchanges? Isn’t the direction very easy? But always remember the manipulation move that comes with the perp. If you do not know your direction when the markets are going ways, this package will tell you the direction. And it will save you from being on the wrong side.
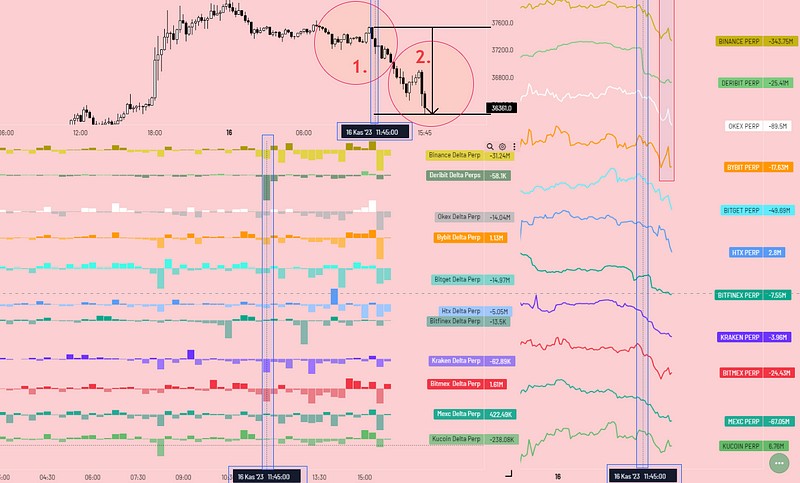
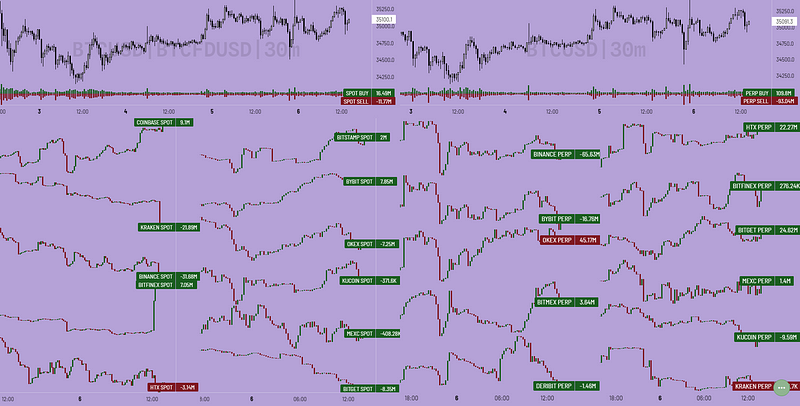
The price is shaped by the algorithm and the big players, not the users. It is necessary to keep track of these big players and be able to foresee the future of the movement. It is important to know what kind of cycle this movement consists of. What will help us here is the perp movement that comes after spot sales. For this, it is necessary to have Bitcoin Perp Data. This detailed perp data will show us which exchange started the movement and how the sales were made. As seen in the image on the side, Deribit exchange was the exchange that started the downward movement by giving a high-leveraged sales candle. These big players give the sales movement first and observing these high candles can make us money. Part 1 was the movement initiated by the Deribit exchange and brought about the decline. If we look at Part 2, here most player thinks that the move is a correction and takes a long position. Would you enter a long position if you knew that this move was manipulation? See leveraged manipulations in full-time by owning this package. Put an end to wrong biases. After Binance, Okx, and Bybit brought an increase by liquidation manipulation, the decline continued. This package has a lot to tell you.
Take Complete Control Over BTC. More Coins Coming Soon In This Package
Become a Master of Tracking Big, Medium, and Small Players
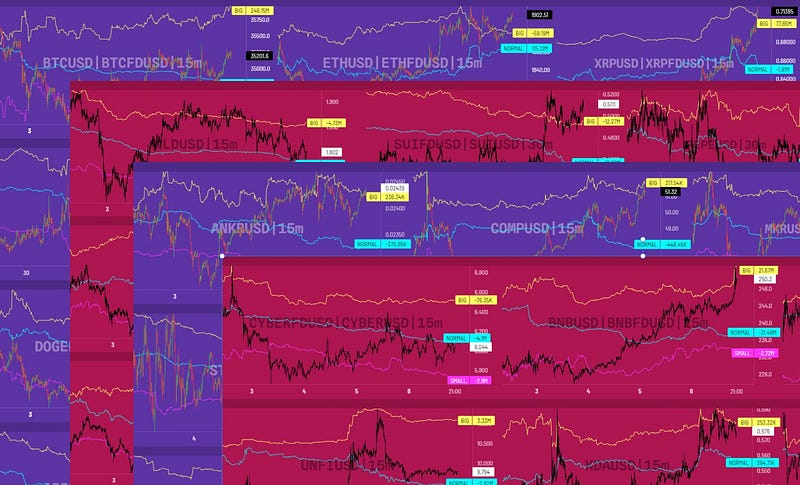
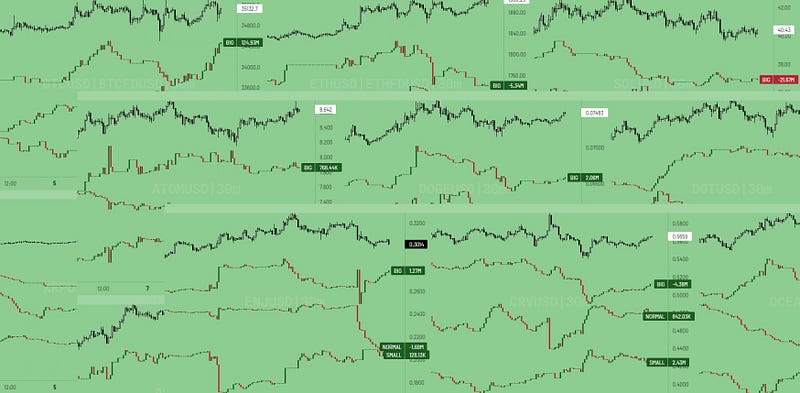
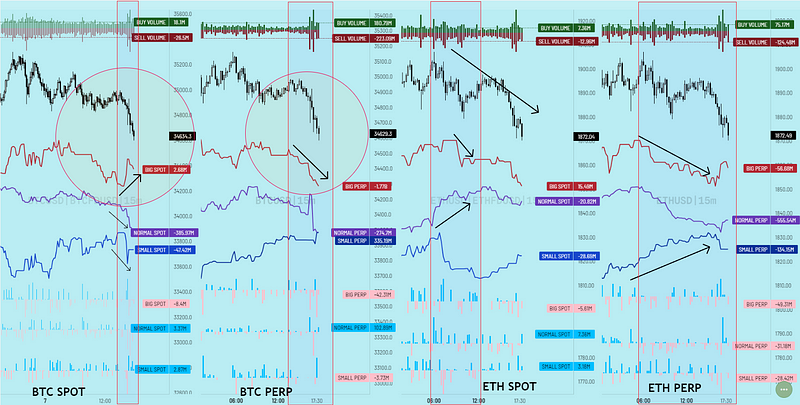
These markets are open to everyone and every player is here to make a profit. Even if you are a big player, you are here to make money. We, on the other hand, want to protect ourselves against all conditions and actors in the market and see what they are doing. What is the rise story of a coin? First, the big players buy slowly from the spot, then they raise the market with big purchases, and then the purchases of the small players are time for them to sell. We can see what big, normal, and small players are doing on the spot side of many coins on 4 different dashboards. Take control in all periods by following the big players and seeing what moves they make. The movements of big, normal, and small players in spot cvd will no longer be able to escape us. This package follows the footprints visible in the snow and shows them all to the dashboard that will remind you of the terminal.
Bitcoin Analysis
An example of BTC is shown above. This is just an example. Strengthen your power with 4 different dashboards containing 84 coins. One package will make you feel like a terminal owner. There will be nothing left in the markets that others know and you don’t know. This package aligns your conditions with the market maker. Instead of losing more money in the markets, spend money on this package and the package will show you special data.
Let the Package Do the Comparison Work for You
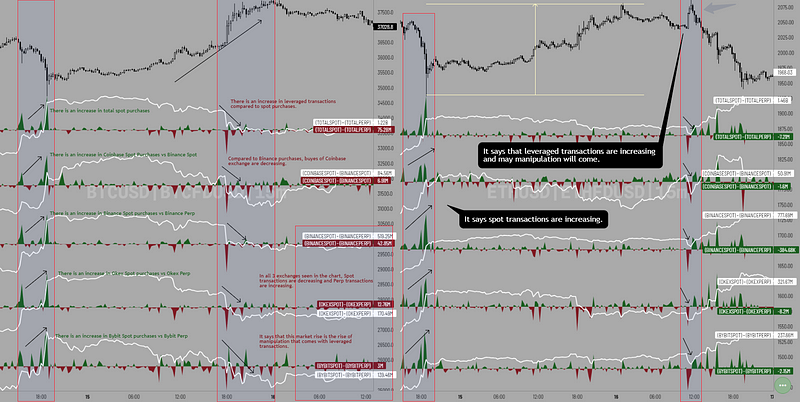
We see Spot and Perp data and compare them with our eyes. So, what would it be like if the indicator compared these data and showed them to you? Here is the comparison indicator. It is a versatile template that compares spot and perp data, Coinbase spot and Binance spot data, and separate spot and perp delta data of exchanges such as Binance, OKEx, and Bybit. We increase comfort and reduce comparisons by looking at 2 data to a single data. This indicator gives you very clear information about the markets. When we come to the image on the side, there is a green and red area in the form of clouds. This data shows the difference between spot delta and perp delta. In this way, we understand at what stage the market is. In the visual, we understand that the decline on the BTC side is manipulation because, with the decline, spot CVD gave a positive value. This shows that the spot side is dominant in bearish transactions. Spot sales are generally sold during the accumulation period. If we interpret that this decrease comes with high leverage, we can say that the spot side purchase transactions increase. And it happens as expected. When we look at the rising part, the clouds have turned to the red side, which tells us that the markets are rising but the leverage side is dominant. So it seems that the markets are experiencing a false rise. Comparison is everywhere. The indicator that makes this easier is waiting for you in this package.
Take Complete Control Over BTC, and ETH. More Coins Coming Soon In This Package
The Importance of the Number of Buyers and Sellers
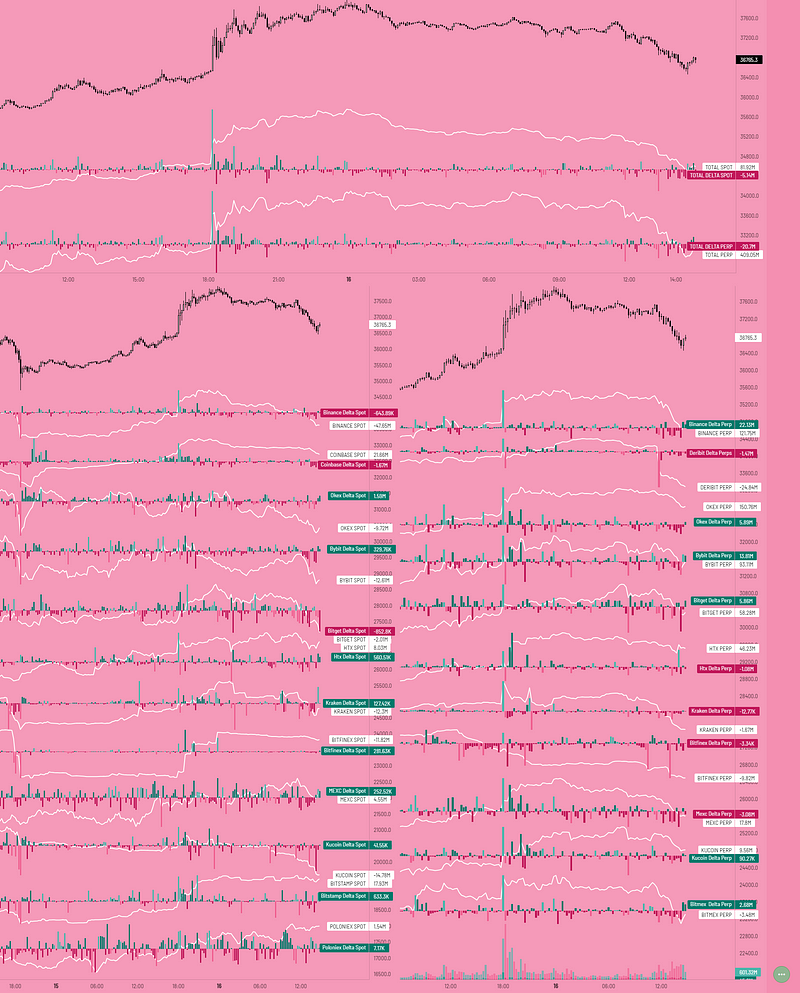
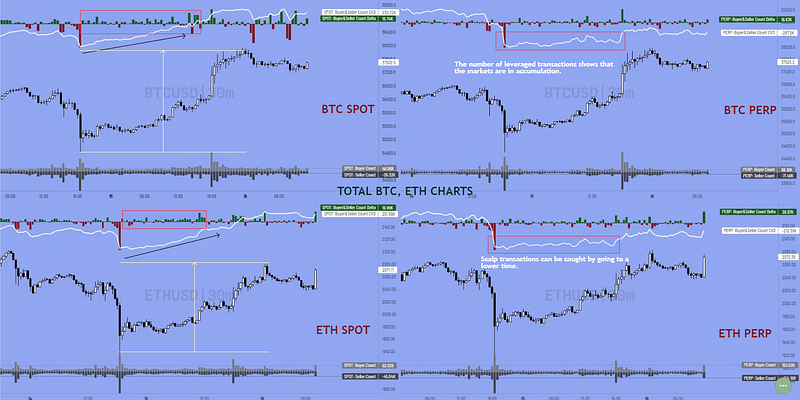
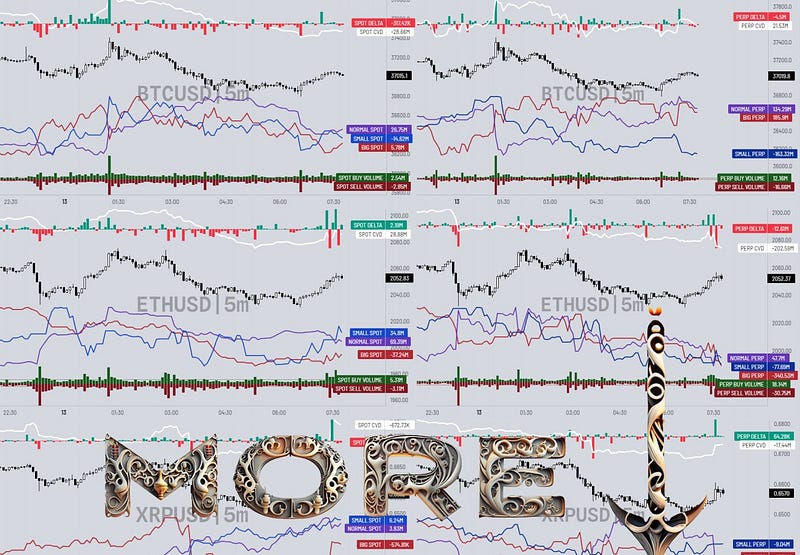
Volume indicators have always been with us, but with this template in the package, you are faced with an indicator that will allow you to see the number of buyers and sellers, which is as important as the volume, and to understand which side is dominant on it. In the markets, there are trading bots, arbitrage bots, bots where exchanges open small amounts but many high-leverage transactions, and liquidity bots, as well as users. All these transactions are not carried out 100% by humans, but many bots do trading. This template counts the number of everything trading. It calculates its delta, cvd, and number and shows it to you. It tells you this by separating spot and perp transactions. The graph is divided into 4 equal parts. Bitcoin spot and perp side are side by side. When we look at the BTC spot side, we see that both the candles on the delta side and the line on the CVD side have increased, meaning that the number of buyers has increased. It is quite simple and understandable. There is no need to get into all that chaos and get confused. The subsequent price rise proves this. The same situation occurs on the ETH side. Guide your trading style by using it across the entire time frame. A model suitable for all transactions such as scalp, daily, and swing is waiting for you in this package.
Take Complete Control Over BTC, and ETH. More Coins Coming Soon In This Package
Be Captivated by the Candlestick Chart
Tired of straight lines? Are candlestick charts, like price charts, clearer to you? Then we included these templates in the package for you. Have candlestick charts of spot and perp data of the exchanges on a single screen. See instantly which exchange has what kind of game plan. Compare data between Spot and Perp. Have full control over Bitcoin and Ethereum.
We also prepared candlestick charts for Big, Normal, and Small Spot CVDs. Watch the big players of 18 coins on candlestick charts in 3 Templates and compare them with the price chart. See what manipulations small players fall for and see them make spot sales. This package tries to give you as much insight into the market as possible. Be careful, manipulations are everywhere. At least eliminate most of the manipulations by having this package.
Anti-Manipulation Package Is Just For You
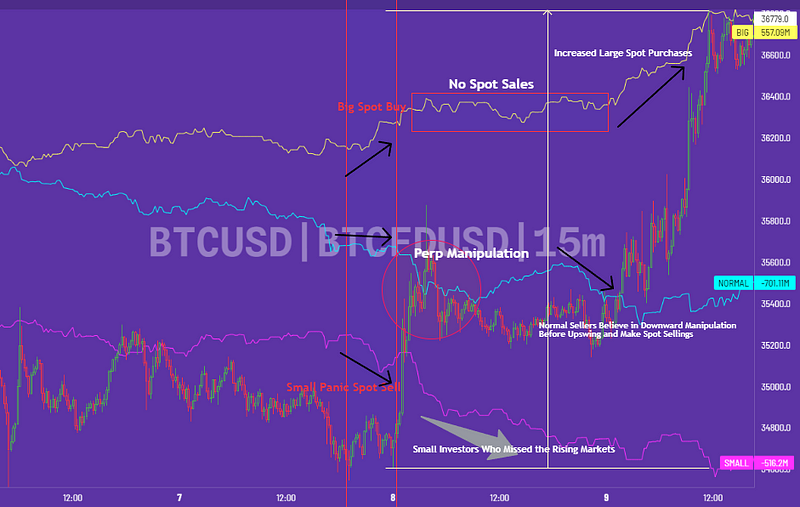
We can see Spot transactions of Large, Medium, and Small Traders, but if you ask, is there no leverage side? There are plenty of them in this package. Now let’s look at what the big players are doing in Bitcoin, both on the spot and perp side. In the image below, we see that the price of bitcoin is falling. It seems that big players have started to buy bitcoin on the spot. We see that we are approaching the end of this decline and that the big players will start to rise when they finish their purchases. Medium and small investors, on the other hand, panicked and sold the price low, and when the price rose, they would have to buy bitcoin at a high price to get involved. To avoid being on this side, this package is just for you. We commented on the spot side, now it’s the turn of the Perp side. We see that spot buyers make big sales on the perp side to ensure that the price is low. And also on the leverage side to ensure that bot sellers move downwards. Thanks to this package, it is that easy to compare. We see that small traders have been carrying long positions for a long time and increasing their long positions when the markets are falling. Many small traders seem to be stuck in reverse, if the price goes down any further their positions will be liquid and they will automatically fall into a short position on the leverage side before the price rises.
Get a Terminal-Like Dashboard
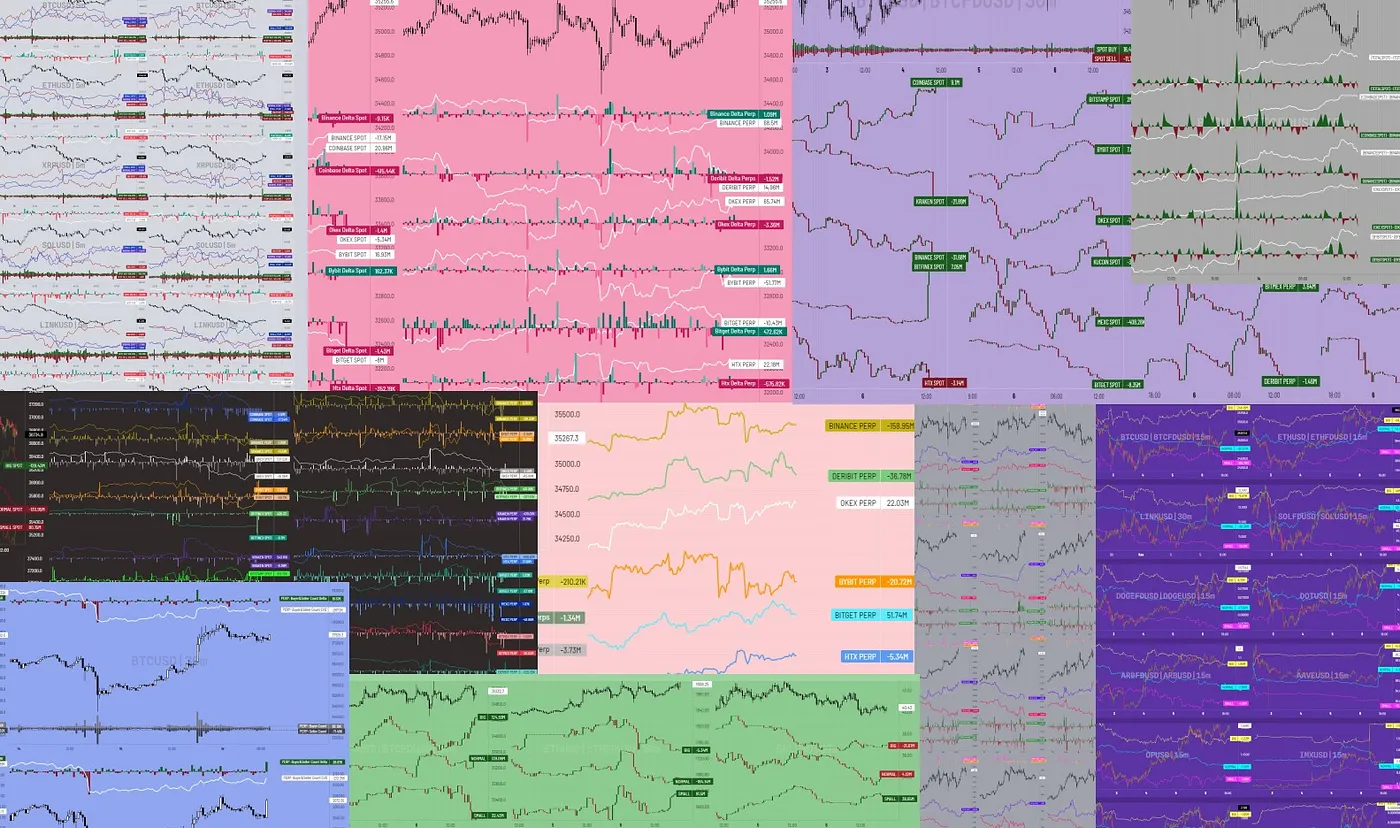
You can find a terminal-like dashboard with many indicators in this package for those who do not like to focus on a single one. It provides the freedom to look at the basic data you need from a single window. This template, which has 22 coins, total spot, and total perp sides side by side, is waiting to be used. You don’t need to clutter your charts with lots of lines you need to draw. There is no need to worry about your monitor not being enough and buying another monitor. All on one screen. All time frames and quick decisions. Meet the package that does not require technical analysis training and course videos. All you need is experience. If you are experienced, this package is more than enough for you.
All and More in This Package
Thank you for reading so far patiently and deciding to have the package. There are other templates in this package that I haven’t mentioned yet. I know that they will give you full strength. There are many aspects to trading in the financial market. This package offers the data that should be open on your monitor, whether you are an investor or a different type of trader. Development always continues, this package will be updated in the future and some coins will be added. So take advantage of this package in your trading. Money is lost or gained in the stock markets. So you know what money control is like. Instead of losing money in the stock markets, subscribe to this package by paying a fee and enjoy trading. Our war is not with other people but with the algorithms in the stock markets. Algorithms have all kinds of data. So what data do you have? For development, first, increase the data you have and try to see every detail. You can start the adventure by subscribing to this package.
To get started on thekingfisher.io, check out the guide. And join us on Twitter or Telegram for any questions or further GEX and liquidations analysis!
Telegram: https://t.me/thekingfisher_btc Twitter: https://twitter.com/kingfisher_btc Website: https://thekingfisher.io/


