Bitcoin’s Toxic Order Flow (TOF)
Informed trading detection along with future liquidations data, are great indicator of liquidity void exacerbating price action volatility.
Expert Analysis of Bitcoin’s Toxic Order Flow (TOF): Impacts and Mitigation
In crypto, as in more traditional stock markets, market participants can be classified into two categories. Informed traders vs uninformed traders. As informed traders’ trading activity increases, this gives an indication that an upcoming price change will occur.
TOF Origins
The study of Toxic Order Flow is often done through the analysis of VPIN: Volume synchronized Probability of INformed trading. Theorized and developed by Easley, Prado, and O’Hara in 2012, the VPIN built upon their previous work on the Probability of Informed Trading (PIN, 1992).
The Kingfisher, inspired by their research, adapted such a model to Cryptocurrency trading activities, allowing interesting conclusions to be taken.
What is TOF?
By analyzing the rate at which trades happen in a given market. One can identify the probability that part of order flow belongs to informed traders, as well as their proportion vs the whole trading volume. The greater the probability and share of said volume being informed, the more likely a spike in volatility is to occur rather soon, given that a new information event happened. The more relevant the “informed traders’ information”, the stronger the volume imbalance will be.
One thing to keep in mind, as per the authors’ observation, though the VPIN is a strong indicator of informed trading and toxicity, its absolute value is rather “meaningless”. One should compare different VPIN numbers between each other rather than considering VPIN levels independently.
Toxic Order Flow refers to the fact that market participants are providing liquidity at a loss to informed traders. A typical example would be retail FOMOing after an Elon Musk tweet or other viral social media post or Pump & Dump scheme, during which mass FOMO ends up filling the standing orders set by the informed traders.
As documented by Jiang Jinzhi (2015), there’s a positive feedback loop between the TOF and high-frequency liquidity. A negative liquidity shock (such as liquidations 🎣) boosts up the VPIN locally, in turn leading to further liquidity drain, and likely further liquidations. Keep your eye out for VPIN occurrences when approaching liquidation clusters as depicted by the Kingfisher’s liquidation maps. Furthermore, during high order flow toxicity, market makers will tend to widen their spread, further increasing the local volatility
Textbook liq hunt & TOF:
On the 30th of May, in the early morning, Bitcoin’s price shot up over 6% within 8h. Can liquidations and toxic order flow offer an explanation as to what happened?
1: Right before the first pump, we can see a short liquidation cluster built up right above the price (box 1) This liquidity was captured by a first “small pump”, forcefully draining the local liquidity
2: Toxic Order Flow starts to build up → market makers slowly remove liquidity (box 2)
3: Pulling a short term liquidation map (optical_opti) shows a new short liquidation cluster built up right below the previous high (box 3)
4: Toxic order flow further increases as liquidity locally drains, yet again, as #3’s liq cluster gets captured, leading to market makers further increasing their spread and removing liquidity
5: Liq all them short 🎣 Thanks for playing!

Textbook liq hunt + Toxic order flow
How to use the Kingfisher’s TOF

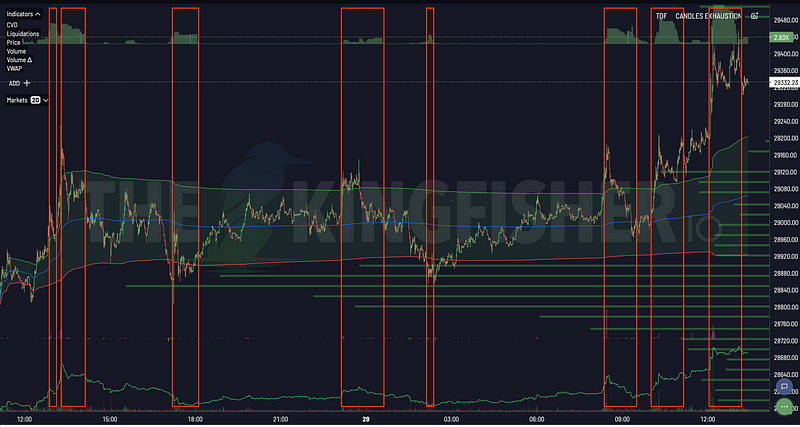
Toxic Order Flow 29–05–2022 || 1 min timeframe
As can be seen on the above screenshot of 1 min candles, spikes in Toxic Order Flow show occurrences of over-extended price action, meant to locally mean revert. One could “easily” trade the local mean reversion and profit of quicks scalps. Note: the green range represents VWAP bands as available on https://pro.thekingfisher.io/
Though the Toxic Order Flow is rather a very short term indicator of upcoming volatility, it has also proven itself useful in higher timeframes (such as the 4h timeframe below)

To get started on thekingfisher.io, check out the guide. And join us on Twitter or Telegram for any questions or further GEX and liquidations analysis!
Telegram: https://t.co/BiVj92ELgb?amp=1 Chat: https://t.me/theKingfisher_btc_chat Twitter: https://twitter.com/kingfisher_btc
KF Pro: https://pro.thekingfisher.io/ Website: https://thekingfisher.io/


