Cartes de Liquidation et Delta de Volume Cumulé
Dans cet article, nous allons montrer comment nous pouvons utiliser l'indicateur de delta de volume cumulé (CVD) pour confirmer un signal de trading issu des…
Cartes de Liquidation et Delta de Volume Cumulé
Dans cet article, nous allons montrer comment nous pouvons utiliser l'indicateur de delta de volume cumulé (CVD) pour confirmer un signal de trading issu des cartes de liquidation du Martin-Pêcheur (Kingfisher).
(Nous considérerons les futures Bitcoin dans cet article, mais cela s'applique à tout marché de contrats à terme).
Le Delta de Volume Cumulé (CVD)
Sur les marchés crypto actuels, le volume reste l'un des indicateurs les plus importants de la participation des traders surendettés (« les parieurs »).
Une manière courante d'évaluer la dynamique d'achat et de vente sur un marché est de suivre les informations Temps & Ventes (T&S) générées par les participants qui entrent dans des transactions en utilisant des ordres au marché. Cependant, si vous avez observé le flux (tape) pendant plus de 5 minutes, vous savez que cela peut être une tâche ardue.
C'est là que le CVD devient utile. Il s'agit d'un total cumulé du delta de volume (VD en abrégé), qui est la différence entre les volumes de vente au marché et les volumes d'achat au marché qui arrivent sur le marché au cours d'une période donnée.
Le CVD peut principalement nous montrer deux choses :
- Le déséquilibre de volume entre les ordres d'achat au marché et les ordres de vente au marché, et donc quel est le flux d'ordres dominant pendant la période étudiée.
- L'impact du flux d'ordres dominant sur le prix (ou l'impact que ce flux permet aux acteurs des ordres à cours limité, alias les mains les plus lourdes, d'avoir).
Maintenant, pourquoi est-ce important ?
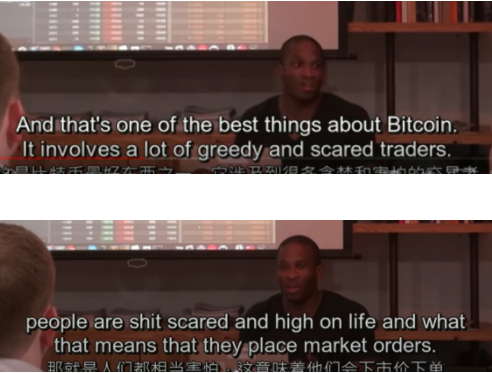
Arthur Hayes, PDG de BitMEX, explique brièvement pourquoi :

A. Hayes sur le Market Making — Youtube BitMEX Source
Ainsi, ce que nous pouvons détecter avec le CVD, c'est la présence d'acheteurs/vendeurs en FOMO tardifs, de suiveurs et de traders de cassure trop motivés sur le marché. En bref, la race spéciale de participants au marché qui sont — involontairement — en train de vendre les plus bas et d'acheter les plus hauts. Ce sont aussi souvent les acteurs qui laissent leurs positions se liquider.
Ceci correspond bien aux cartes de liquidation du Martin-Pêcheur.
Combiné avec les Cartes de Liquidation du Martin-Pêcheur
Avez-vous déjà vu votre position longue liquidée à un creux ? Ou votre position courte liquidée à un sommet ? Avant que le marché ne ramène le prix là où vous le souhaitiez ?
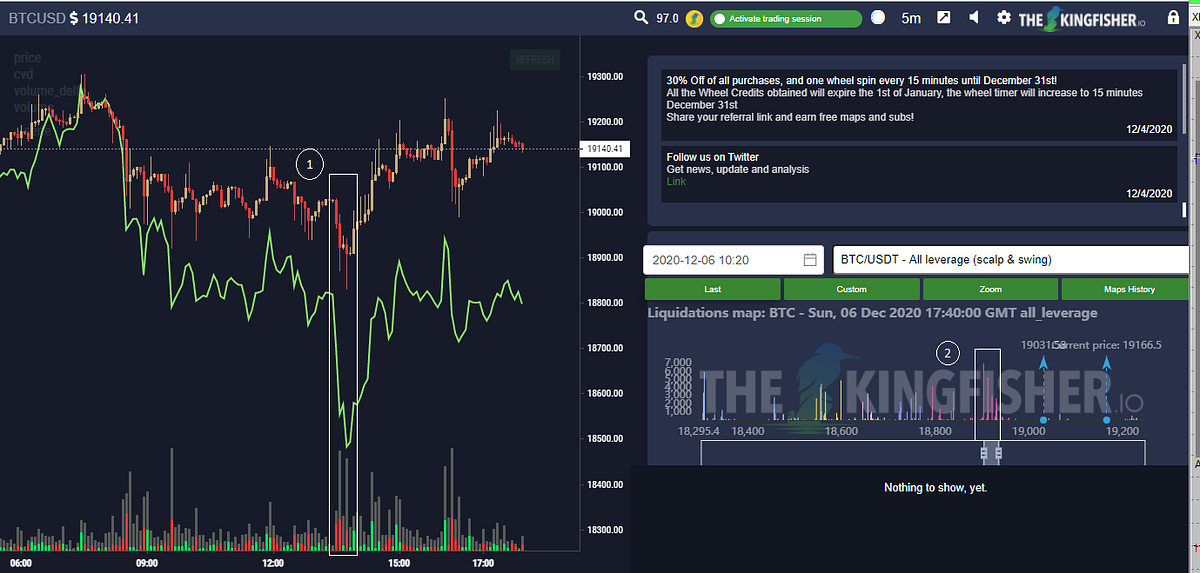
Dans l'exemple suivant, nous voyons que la carte de liquidation au point 2 nous montre que la zone de prix de 18 850 est un cluster majeur de liquidations.
1- Divergence CVD, 2- Cluster de Liquidation à 18 850
Le graphique des prix nous montre qu'il y a déjà une pression vendeuse nette sur le marché avant le creux marqué au point 1, lorsque le CVD diverge lentement du prix pendant que le marché dérive vers le creux.
Le CVD, et le delta de volume au plus bas, nous montrent ensuite que la pression vendeuse s'est accélérée vers le creux de 18 850, pourtant, le prix n'a pas chuté autant que nous aurions pu l'attendre, compte tenu du volume de ventes entré sur le marché. Cela nous indique que les vendeurs n'ont pas obtenu la baisse de prix qu'ils espéraient et commencent donc à être un peu frustrés. Cela nous indique également qu'en parallèle, des acheteurs passifs étaient prêts à intervenir sur le marché à ce niveau de prix avec des ordres d'achat pour prendre l'autre côté de la transaction et « absorber » toutes les ventes.
Une fois que le prix commence à remonter, car les anciens acheteurs passifs se transforment en preneurs achetant le prix à la hausse avec leur propre agressivité, tous les shorts sous le niveau de prix de 18 900 commencent à s'inquiéter ; une fois que le prix monte encore un peu plus, tous les shorts sous le niveau de prix de 19 000 sont en difficulté et doivent finalement se couvrir ou être liquidés. Cela provoque une dynamique de cascade de couverture qui peut faire monter le prix fortement, car tous les shorts doivent couvrir leurs positions via des stop-loss ou des liquidations (pour les traders très endettés sur une si courte période), générant à leur tour encore plus de flux acheteur soutenant la hausse.
Bienvenue dans le jeu.
Et tout a commencé par un cluster de liquidation significatif d'abord indiqué par la Carte de Liquidation du Martin-Pêcheur.
Note annexe sur le CVD
La lecture du CVD pour les contrats perpétuels de BTC (futures) est différente de celle des marchés spot BTC sur les plateformes spot (Vous pouvez essayer cela en activant/désactivant les plateformes sur The Kingfisher comme montré ci-dessous).

Dans les Paramètres, vous pouvez activer/désactiver les plateformes futures et spot.
La raison en est que dans les Futures Perpétuels BTC, l'achat au marché et la vente au marché sont également faciles pour les deux côtés, contrairement aux marchés spot BTC (où il est soit impossible de vendre à découvert du BTC, soit il faut d'abord emprunter du BTC, comme lors de la vente à découvert d'actions). Cette même facilité d'acheter ou de vendre des perpétuels est ce qui rend les perpétuels BTC plus représentatifs des participants exprimant leurs émotions dans le trading impulsif…
Voir la citation d'Arthur Hayes ci-dessus.


