What is a Bitcoin liquidation heatmap?
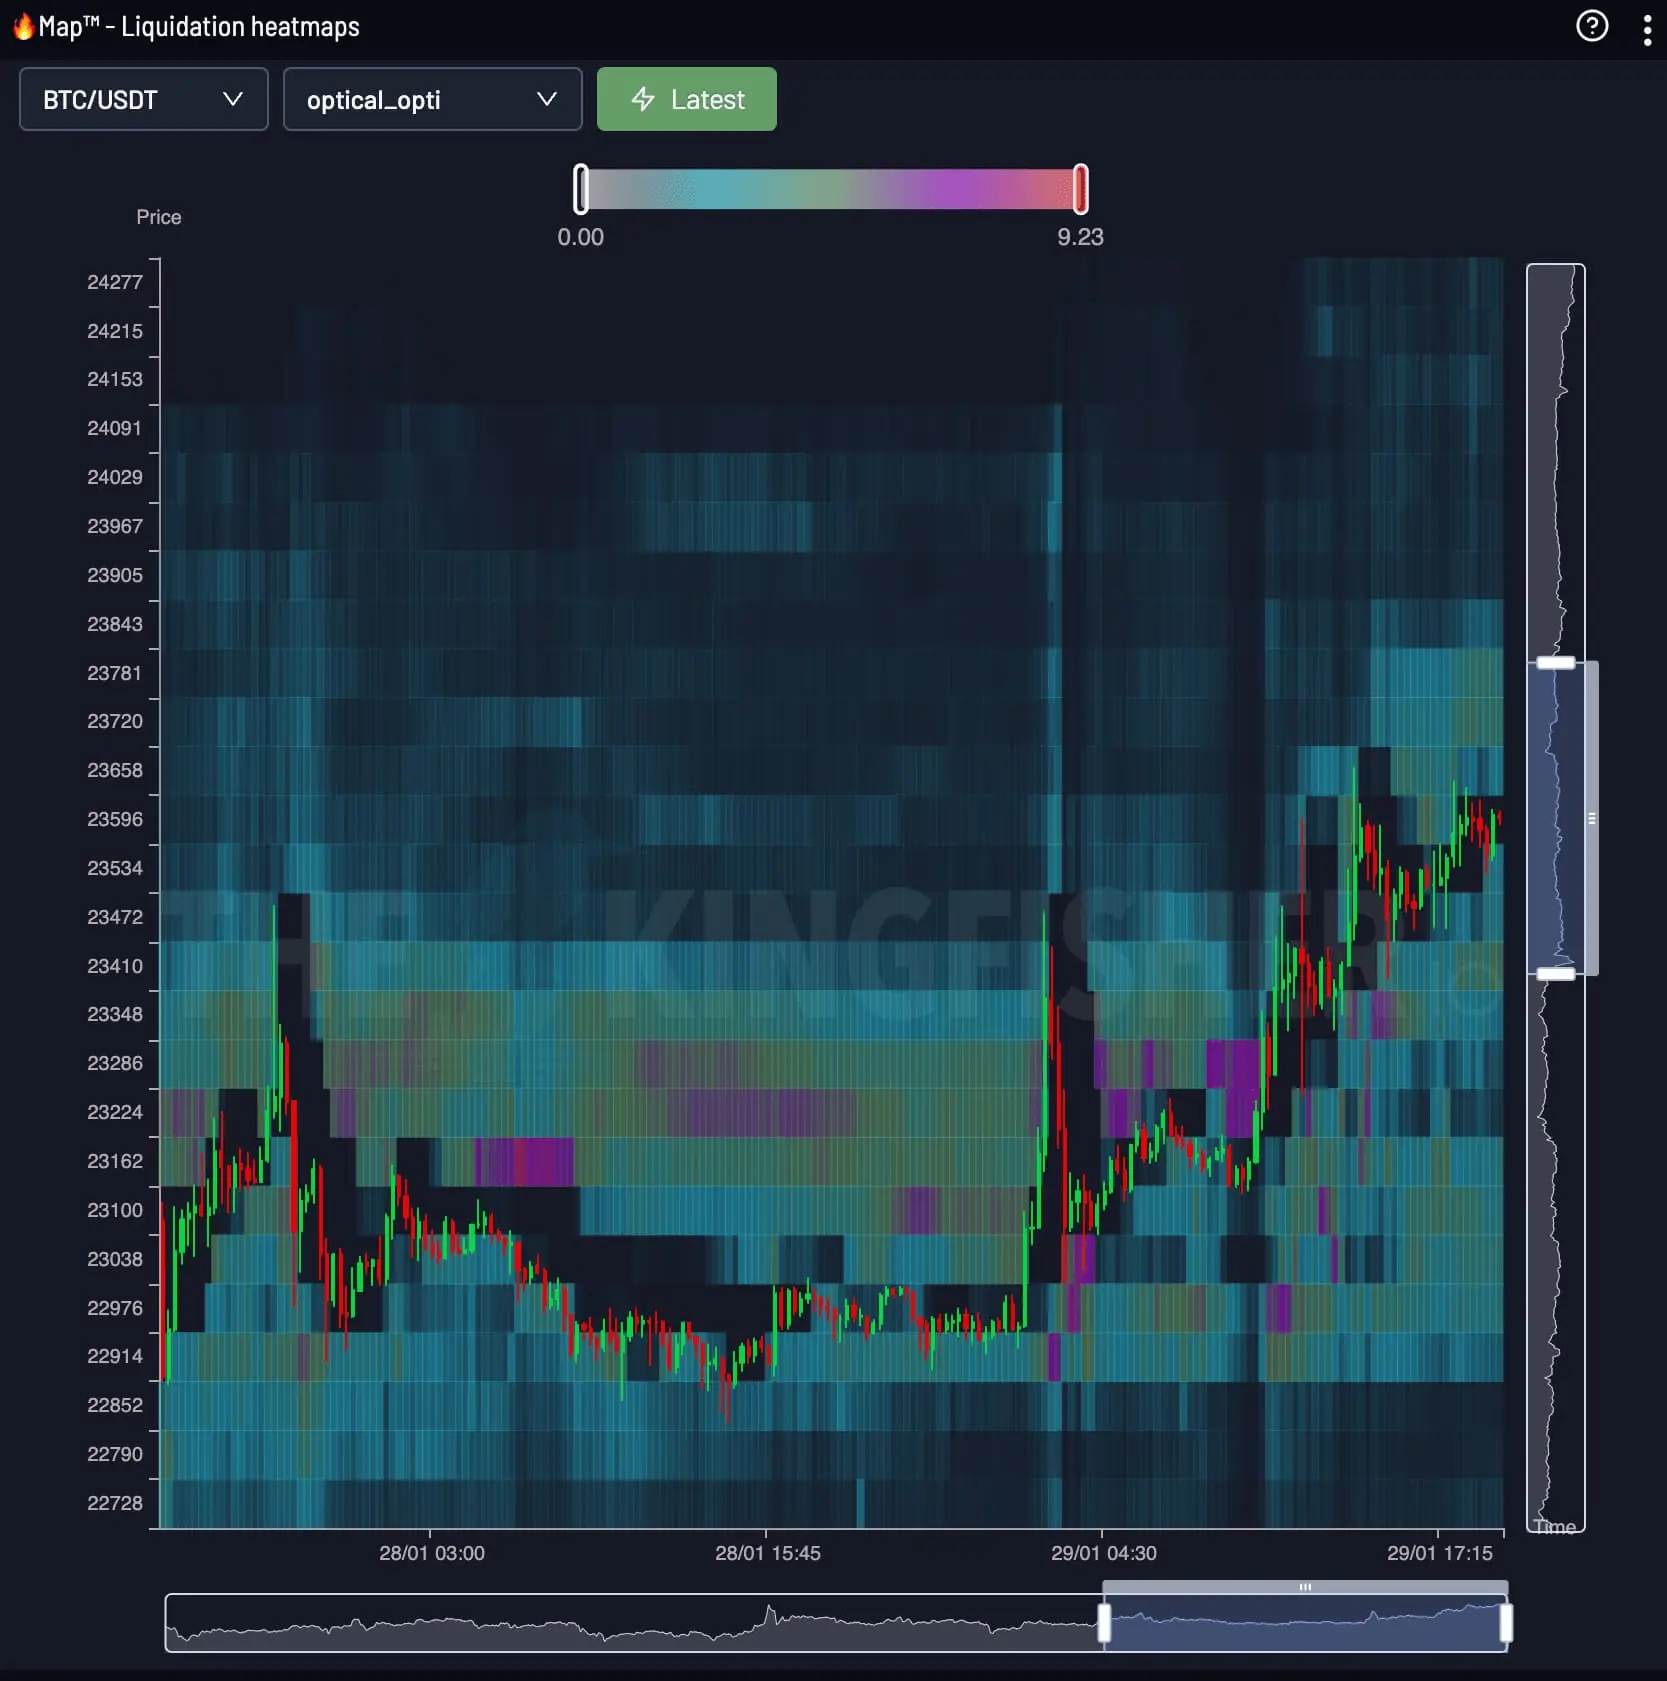
A liquidation heatmap plots relative liquidation pressure on two axes: price vertically and time horizontally.


Heatmap · GRT / USDT
The Graph (GRT) Real-Time Liquidation Clusters
Follow liquidation pressure across price and time as the market builds, moves and clears leveraged positions.
Price × Time
The Kingfisher Heatmap turns successive LiqMap readings into a continuous view. Color intensity makes the strongest zones and their evolution visible at a glance.
A liquidation heatmap plots relative liquidation pressure on two axes: price vertically and time horizontally.
Start from the live price, compare the brightest bands above and below it, then follow each band across time to see whether pressure is building or fading.
Bright, persistent bands reveal where liquidation pressure is concentrated. Bands that fade or disappear show where that pressure has weakened or cleared.
GRT / USDT
The brightest bands on the GRT map mark the price levels holding the most modeled liquidation risk, right now. Price gravitates toward these bands because forced orders wait inside them.
A stop placed inside a dense cluster gets swept by the wick that clears the band. Place yours beyond the cluster edge and size the position so that distance costs a fixed fraction of the account.
Check the distance from entry to the nearest heavy cluster before choosing leverage. The calculator below converts that distance into a liquidation price for any leverage tier.
LiqMap / Heatmap
LiqMap shows the liquidation structure around price at one point in time. Heatmap adds the time axis so you can follow where that structure builds, moves and clears.
| Dimension | GRT Liquidation Map | GRT Liquidity Heatmap |
|---|---|---|
| Shows | Liquidation price levels, tier by tier | Heat intensity of pressure over time |
| Axes | Price x leverage estimate | Price x time (rolling 24h) |
| Answers | Where exact levels and cluster walls sit | When pressure builds toward a level |
| Best use | Placing stops and entries | Timing the test of a level |
Traders read both together: the map gives the level, the heatmap gives the timing. Open the GRT liquidation map view for tier-by-tier levels.
The Graph Liquidation MapEnter your entry price, leverage and side. The calculator returns your exact GRT liquidation price and position size before you commit margin.
Open the full GRT calculatorThe Kingfisher Terminal
Open the live Heatmap in The Kingfisher terminal. Snapshot and Footprint views are included with Premium access.
FAQ
Everything you need to know about Bitcoin liquidation heatmaps
Price runs on the vertical axis and time on the horizontal axis. Clusters below the current price are long liquidation levels; clusters above it are shorts. The brighter the band, the more liquidation volume waits at that price, and price tends to test bright bands before breaking through.
A liquidation map shows liquidation price levels tier by tier by leverage, which traders use for placing stops and entries. A liquidation heatmap shows how that pressure accumulates over time in a rolling 24h window, which traders use for timing. Read both together: the map gives the level, the heatmap gives the timing.
Liquidations force market orders that amplify the move into the cluster, so dense clusters act like magnets and their break accelerates the impulse. The map shows zones of risk, not guaranteed price targets.