What a Scalping Toolbox Can, and Cannot, Show
Crypto scalping compresses market noise, fees, spread, execution quality, and rapid position changes into a short observation window. A chart can describe what has happened, but it cannot guarantee what happens next. The purpose of a toolbox is therefore not to generate a certain entry or exit. It is to separate different types of market information so that an analyst can document a hypothesis and the evidence against it.
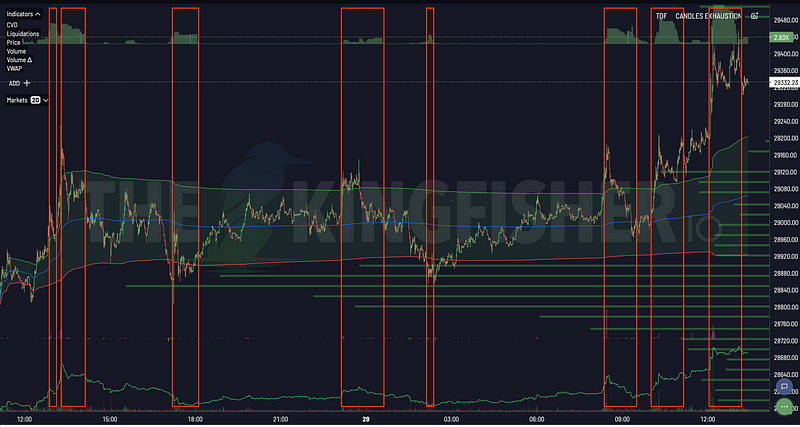
This guide explains five views commonly used in the Kingfisher workflow:
| View | Analytical question | Important limitation |
|---|---|---|
| LiqMap | Where might leveraged positions be vulnerable under the model? | Zones are estimates, not disclosed orders or price targets. |
| Toxic Order Flow (TOF) | Does recent flow look unusually informed or imbalanced under the metric? | A high reading does not identify an actor or prove intent. |
| Funding | Which side is paying to maintain perpetual exposure? | Funding can remain one-sided while price moves in either direction. |
| Open Interest (OI) | Is aggregate derivatives exposure expanding or contracting? | OI does not reveal every participant’s direction or motive. |
| Cumulative Volume Delta (CVD) | How has classified aggressive buy and sell volume evolved? | Classification and venue coverage affect the result. |
The views answer different questions. Agreement between them is still only contextual evidence; disagreement is useful because it exposes uncertainty that a single chart can hide. See where forced selling sits right now on the live Ethereum liquidation map. For a fuller treatment, Kingfisher Success Stories: How Traders Actually Use the Data covers the whole workflow.
1. Reading Liquidation Maps at Short Horizons
A liquidation map estimates price areas where leveraged positions may approach forced closure. It is derived from available market inputs and modelling assumptions. Exchanges do not publish a complete list of every trader’s liquidation price, so a map should not be described as an order book of guaranteed future liquidations.
When reviewing a short-horizon map, record:
- the asset, venue coverage, model view, and observation time;
- the distance between market price and each visible zone;
- whether a zone persists, grows, shrinks, or disappears across snapshots;
- whether several nearby zones overlap or remain isolated;
- what would make the initial interpretation invalid.
Distance and visual intensity are descriptive features, not probabilities by themselves. A visible zone may be reduced before price reaches it, and price may cross a modelled area without the reaction expected by an analyst.
A Neutral LiqMap Note
Instead of writing “price will move to the cluster,” use a falsifiable note:
A modelled liquidation zone is visible above the market in this snapshot. I will compare later snapshots and independent flow data before deciding whether the zone remains relevant.
That wording preserves the observation without turning it into a forecast.
2. Interpreting Toxic Order Flow
TOF is an order-flow metric intended to describe whether recent activity resembles informed or unusually imbalanced participation under its model. It does not reveal the identity of a trader, prove manipulation, or determine direction on its own.
Useful questions include:
- Did the reading change before, during, or after the price move?
- Is the change visible across more than one observation window?
- Does ordinary news, rebalancing, or a venue-specific event offer another explanation?
- Does volume confirm the change, or is the reading based on a small sample?
- Does the signal persist when the market moves away from the initial level?
A spike may accompany informed trading, but it may also reflect hedging, news response, liquidation flow, or temporary liquidity conditions. The honest conclusion is often “unusual flow is present; cause and direction remain uncertain.” How to Interpret the Leverage Effect in Crypto Markets walks through this in more detail.
3. Funding and Open Interest as Context
Funding transfers value between long and short perpetual positions. It helps describe the cost of holding exposure and the balance between the perpetual contract and its reference market. It does not establish that the paying side must close or that a reversal is imminent.
Open interest measures outstanding derivatives exposure. A change in OI can be compared with price and funding, but several explanations may fit the same combination:
| Observation | Possible interpretations |
|---|---|
| Price and OI both rise | New exposure may be entering, but direction and hedge structure remain uncertain. |
| Price rises while OI falls | Positions may be closing; the data alone does not identify which participants. |
| Price falls while OI rises | New exposure may be entering during weakness; it is not automatically bearish continuation. |
| Price and OI both fall | Exposure may be closing or being liquidated; venue detail matters. |
Funding, OI, and price are best stored as a time series rather than reduced to a single label such as “bullish” or “bearish.”
4. CVD and Trade-Size Views
CVD accumulates classified aggressive buying and selling. Depending on the implementation, the classification may use trade direction, venue data, and size buckets. Those choices should be understood before comparing one CVD view with another.
A divergence between price and CVD is an observation, not a completed trade thesis. It may reflect absorption, hidden liquidity, venue fragmentation, classification noise, or a temporary change in participation. Confirmation after the fact does not prove that the divergence predicted the move.
For a reproducible note, capture:
- the venue set and time window;
- whether the divergence appears in aggregate and in relevant size buckets;
- whether price structure changes while the divergence persists;
- alternative explanations, including thin liquidity or a single large print;
- the condition that would invalidate the interpretation.
5. Combining the Views Without Creating a “Signal Machine”
The safest way to combine multiple indicators is to assign each one a narrow role.
| Evidence layer | What it contributes | What it does not establish |
|---|---|---|
| LiqMap | Modelled vulnerability by price area | A destination or guaranteed cascade |
| TOF | Unusual flow under the metric | Actor identity, intent, or direction |
| Funding and OI | Positioning and carrying-cost context | A reversal time |
| CVD | Classified aggressive-flow history | A guaranteed continuation or reversal |
| Price and liquidity | Observed market response | The cause of the response |
“Confluence” should mean that several observations are consistent with one hypothesis. It should not mean that the hypothesis has become certain. A useful analysis also lists disconfirming evidence.
A Repeatable Session Review
Before the Observation Window
Create a context card containing:
- instrument and venues;
- observation horizon;
- major scheduled events that may affect liquidity;
- current funding and OI snapshot;
- visible LiqMap zones;
- the exact data timestamp for every panel.
During the Window
Log changes rather than conclusions:
- price and spread changed;
- a modelled zone persisted or changed;
- TOF rose, fell, or remained stable;
- CVD agreed or disagreed across size views;
- OI expanded or contracted;
- a plausible alternative explanation appeared.
After the Window
Compare the original note with the observed outcome. Avoid relabelling an ambiguous chart after the move. A useful review asks whether the hypothesis was stated before the outcome, whether its invalidation condition was clear, and whether the same method can be repeated on another sample.
Hypothetical Example
Suppose a LiqMap snapshot shows a modelled zone above market price while TOF and CVD remain mixed. Funding is positive and OI has changed little.
The defensible conclusion is limited: the model shows potential leveraged vulnerability above the market, but the flow views do not provide consistent confirmation. It would be inaccurate to say that price is destined for the zone or that a squeeze has begun. A later snapshot may strengthen, weaken, or invalidate the original observation.
Common Analytical Errors
Treating a Zone as a Target
A liquidation zone is conditional on positions and market inputs that can change. “Visible” and “inevitable” are not synonyms.
Assigning Intent From Flow Alone
Order-flow metrics cannot distinguish every hedge, liquidation, market-making action, or directional trade. Labels such as “whale manipulation” require evidence the chart does not provide.
Using Fixed Thresholds Across Assets
Liquidity, volatility, venue mix, and contract design differ. A fixed numerical cutoff can create false comparability between instruments.
Ignoring Timestamps and Coverage
Panels built from different venues or update times can appear to confirm one another while describing different samples.
Reporting Only Successful Examples
Selected screenshots are not a performance study. A credible review includes invalidated hypotheses and defines the sample before measuring outcomes.
FAQ
Does the toolbox predict the next short-term move?
No. It organizes modelled liquidation risk, order flow, funding, open interest, and volume-delta observations. None of those inputs guarantees direction, timing, execution quality, or profit.
Is a high TOF reading proof of manipulation?
No. It can flag unusual activity under the metric, but intent requires evidence beyond an order-flow score.
Does a CVD divergence establish a reversal?
No. Divergence can have several explanations and may persist. It is a prompt for further investigation.
Why compare several views?
Because each view has different blind spots. Comparing them can reveal whether a hypothesis is consistent with several independent observations or depends on one noisy input.
Where can I verify current Kingfisher access and pricing?
Plan names, entitlements, and prices can change. Check the authenticated Kingfisher app for the current information rather than relying on an article snapshot.