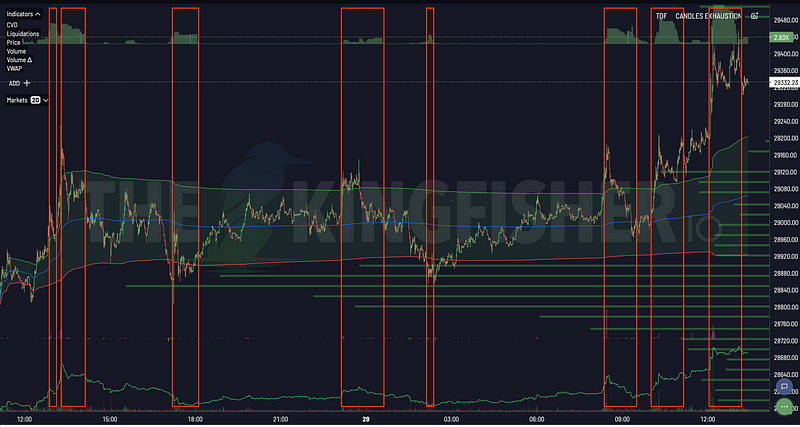
Detection Is Not the Same as Proof
Abrupt price moves, disappearing liquidity, concentrated liquidations, and unusual order flow can look manipulative. They can also result from ordinary market making, hedging, news, thin liquidity, forced closures, or data-quality problems.
No public chart can establish a participant’s identity or intent by itself. A defensible analysis therefore uses phrases such as “suspicious pattern,” “possible manipulation,” or “requires further investigation.” It does not claim that a person or venue manipulated the market unless reliable evidence supports that conclusion.
This guide presents a surveillance workflow for live market observations. It is educational and does not provide a guaranteed detector, a prediction, or an execution strategy. The live Ethereum liquidation map shows those levels on the current price ladder. The live Solana liquidation map shows those levels on the current price ladder.
What “Manipulation” Can Mean
The word is often used too broadly. Several very different events may produce a similar chart:
Spoofing-Like Order-Book Behaviour
Large displayed orders appear near the market and are cancelled before execution. A public order-book feed can show the sequence, but it does not necessarily reveal ownership, coordination, or whether the cancellation had a legitimate explanation.
Wash-Trading-Like Activity
Transactions may create the appearance of activity without transferring meaningful economic risk. Detecting this reliably usually requires account-level or venue-level information that public market data does not contain.
Coordinated Promotion and Selling
Promotional messages may coincide with concentrated buying and later selling. Timing alone is not proof of coordination; communications, account relationships, and transaction evidence matter.
Liquidation Cascades and Stop Concentration
Price can accelerate through areas containing leveraged positions or stop orders. Participants may anticipate these mechanics without engaging in unlawful conduct. A cascade is not automatically evidence of manipulation.
Dealer Hedging and Rebalancing
Options hedging, index rebalancing, inventory management, and risk reduction can create concentrated flow that resembles a directional attack.
Legal definitions and enforcement standards vary by jurisdiction and fact pattern. Current conclusions should be checked against primary regulatory sources or qualified counsel rather than inferred from this article.
An Evidence Ladder for Live-Market Review
Use independent evidence layers and keep their conclusions separate.
| Evidence layer | What it may show | What it cannot prove alone |
|---|---|---|
| Price and executed volume | Abrupt movement or unusual participation | Identity, coordination, or intent |
| Order book | Placement, modification, and cancellation patterns | Beneficial ownership or motive |
| TOF or flow metric | Activity classified as unusual under a model | That the activity is illegal manipulation |
| Liquidation map | Modelled areas of leveraged vulnerability | That an actor targeted the area |
| Cross-exchange comparison | Whether the event is broad or venue-specific | Why venues differ |
| Public news and announcements | A possible external catalyst | That every observed trade responds to it |
| On-chain or venue disclosures | Additional attribution context | Complete off-chain account relationships |
The strongest conclusion permitted by public data is often that several observations are consistent with a hypothesis. That is not the same as proving the hypothesis.
1. Toxic Order Flow as an Anomaly Flag
Toxic Order Flow (TOF) is intended to describe whether recent flow resembles informed or unusually imbalanced activity under its model. A change can prompt closer inspection, but it does not label a trader, determine intent, or guarantee direction.
Record:
- the metric definition and data coverage;
- the observation timestamp and aggregation window;
- whether the change preceded or followed price movement;
- whether it persists across several windows;
- whether news, hedging, liquidation flow, or rebalancing offers another explanation.
Avoid writing “TOF proves manipulation.” A more accurate note is “TOF changed materially under this configuration; the cause remains unverified.”
If any term here is new, the order book entry covers it in depth.
2. Liquidation Maps as Vulnerability Context
A liquidation map estimates where leveraged positions may approach forced closure. It does not expose a complete list of trader stops and does not show that a specific actor intends to move price toward a zone.
The map can add context when a rapid move approaches modelled vulnerability, especially if the zone persists across snapshots. It should still be treated as conditional: positions can close, hedges can change, and model inputs can become stale. How Liquidation Heatmaps Work: LiqMap Origins, Reading Method, and Limits walks through this in more detail.
3. Cross-Exchange Comparison
A venue-specific move deserves comparison with other liquid markets. Differences can arise from liquidity, quote currency, contract design, regional participation, index construction, or temporary technical conditions.
For each venue, compare like-for-like instruments and capture:
- best bid and ask rather than only last trade;
- executed volume and trade direction methodology;
- visible depth and cancellations;
- index or mark-price behaviour;
- timestamps and feed delays;
- venue status notices.
If the contracts or timestamps differ, the comparison may create a false anomaly.
4. Order-Book and Trade Evidence
Displayed liquidity is not a promise to remain in the book. Legitimate orders may be cancelled as price, inventory, or risk changes. A suspicious sequence requires more than a screenshot.
An audit record should preserve the order-book updates around the event, subsequent executions, the duration of displayed liquidity, and whether similar patterns occurred repeatedly. Even then, public identifiers may not establish common control.
Hypothetical Case: A Fast Move Toward a Modelled Zone
Suppose price falls rapidly toward a liquidation zone while TOF rises and visible bids disappear on one venue. The same asset moves less on other venues, and no public news is immediately visible.
Several hypotheses fit:
- a large directional seller crossed a thin book;
- market makers withdrew liquidity during uncertainty;
- forced closures amplified an ordinary move;
- a venue-specific technical issue affected pricing;
- manipulative activity may have occurred.
The data supports investigation, not a final accusation. Later venue notices, order-level records, or regulatory findings could change the conclusion.
Hypothetical Case: A Breakout That Quickly Reverses
Suppose price crosses a widely watched level, volume rises, and the move reverses soon afterward. A reversal alone does not prove a “stop hunt.” It may reflect failed demand, profit taking, hedging, a liquidity gap, or concentrated stop execution.
A useful record compares the event across exchanges, checks whether aggressive flow persisted, and notes whether modelled liquidation zones changed before and after the move. It avoids assigning intent from the shape of the candle.
A Reproducible Surveillance Log
Observation Header
- asset and exact contract;
- venues included;
- timezone and timestamps;
- data sources and known delays;
- relevant scheduled events;
- initial hypothesis stated conditionally.
Evidence Table
| Observation | Supports hypothesis? | Alternative explanation | Data limitation |
|---|---|---|---|
| Price/volume anomaly | Yes, no, or mixed | News or thin liquidity | Aggregation window |
| TOF change | Yes, no, or mixed | Hedging or liquidation flow | Model classification |
| LiqMap zone | Yes, no, or mixed | Coincidental proximity | Estimated positions |
| Cross-venue divergence | Yes, no, or mixed | Contract or index difference | Timestamp alignment |
| Order-book sequence | Yes, no, or mixed | Legitimate repricing | No participant identity |
Review
Keep the original note unchanged and add the later outcome separately. This prevents hindsight from turning an ambiguous observation into an apparently obvious call.
What the Workflow Must Not Claim
- A flow score does not prove criminal or civil misconduct.
- A liquidation zone does not prove that anyone targeted it.
- A venue divergence does not prove that one exchange is dishonest.
- A successful retrospective example does not establish detector accuracy.
- Absence of public news does not mean a move has no legitimate cause.
- Multiple correlated indicators are not necessarily independent confirmation.
Common Review Errors
Starting With an Accusation
If every observation is interpreted as manipulation, the process cannot disprove itself. Start with several plausible hypotheses.
Treating “Unusual” as “Illegal”
An anomaly detector identifies difference from a baseline. Legality depends on conduct, evidence, and applicable law.
Ignoring Data Latency and Gaps
Panels with different timestamps can create a false lead-lag relationship. Record the effective time of each source.
Comparing Different Contracts
Spot, inverse futures, stablecoin-margined perpetuals, and venue indexes are not interchangeable.
Publishing a Named Accusation Without Evidence
Public allegations can create legal and reputational risk. Describe observable behaviour and cite authoritative findings when they exist.
FAQ
Can TOF detect manipulation with a known accuracy rate?
This article does not claim one. Accuracy would require a labelled dataset, a published definition of manipulation, a fixed method, and out-of-sample evaluation. Public charts rarely provide a complete ground truth.
Is a liquidation cascade manipulation?
Not by itself. It is a market mechanism in which forced closures can amplify movement. Intent and conduct require separate evidence.
Why compare exchanges?
Comparison helps determine whether an event is broad or venue-specific. Differences still need to be explained carefully because contracts, liquidity, and timestamps vary.
Can this workflow predict a reversal?
No. It is a documentation and investigation framework, not a direction or timing model.
Where can I verify current Kingfisher access and pricing?
Features, entitlements, and prices may change. Check the authenticated Kingfisher app for current information.