Live Cryptocurrency Trading: Evidence-Based Evaluation

Live Cryptocurrency Trading: Evidence-Based Evaluation

Live cryptocurrency trading involves real-time execution of trades based on market analysis, typically holding positions from minutes to hours. This article examines the strategies, infrastructure requirements, performance data, and risk considerations for active cryptocurrency trading.

Key Statistics

  • Daily trades: 2.3 billion trades executed globally (CoinGecko, 2024)
  • Profitability rate: 13-15% achieve consistent success (Journal of Finance, 2023)
  • Average holding time: 3.4 hours for profitable day trades (Coinbase, 2024)
  • Volatility advantage: Bitcoin shows 3.2x traditional asset volatility (Messari, 2024)
  • Transaction cost impact: Fees reduce returns by 23-45% annually

Live Trading Strategies

Scalping

Scalping captures small price movements quickly:

  • Holding period: Seconds to minutes
  • Profit target: 0.1-0.3% per trade
  • Trade frequency: 20-100+ daily
  • Success rate: 48-55% typical

A 2023 Quantitative Finance study found that transaction costs eliminated profits for scalping strategies averaging less than 0.25% per trade before fees.

Breakout Trading

Breakout trading captures momentum from consolidation:

  • Pattern identification: Range boundaries and triangles
  • Entry signals: Volume confirmations on breaks
  • Success rate: 58-62% with volume confirmation
  • Risk-reward: Typically 1:2 to 1:3

Chart patterns with volume confirmation show 15-20% higher success rates than those without (Journal of Technical Analysis, 2023).

Range Trading

Range trading buys support and sells resistance:

  • Identification: Fibonacci, previous highs/lows
  • Success rate: 52-58% in established ranges
  • Risk management: Stops placed outside range

Liquidation maps help identify range boundaries by showing where forced liquidations may create support or resistance.

Technical Analysis Implementation

Indicator Integration

Real-time technical analysis requires:

  • RSI: Overbought/oversold identification (58% reversal accuracy below 30/above 70)
  • MACD: Trend change and momentum signals
  • Moving averages: Trend identification and dynamic support
  • Volume patterns: Confirmation of price movements

Research (arXiv:2306.11234) found combining 2-3 uncorrelated indicators achieves 61-65% accuracy, compared to 50-55% for single indicators.

Chart Pattern Recognition

Common patterns and success rates:

  • Head and shoulders: 62% reach measured targets (arXiv:2307.13456)
  • Triangles: 55% break out in prior trend direction
  • Flags/pennants: 58% continuation after consolidation

Automated pattern recognition systems achieve 70-80% identification accuracy but require volume confirmation for reliability.

Market Structure Analysis

Liquidation Maps

Understanding forced position closures:

  • Support levels: Buy-side liquidation clusters
  • Resistance levels: Sell-side liquidation clusters
  • Cascade potential: Sequential liquidation risk

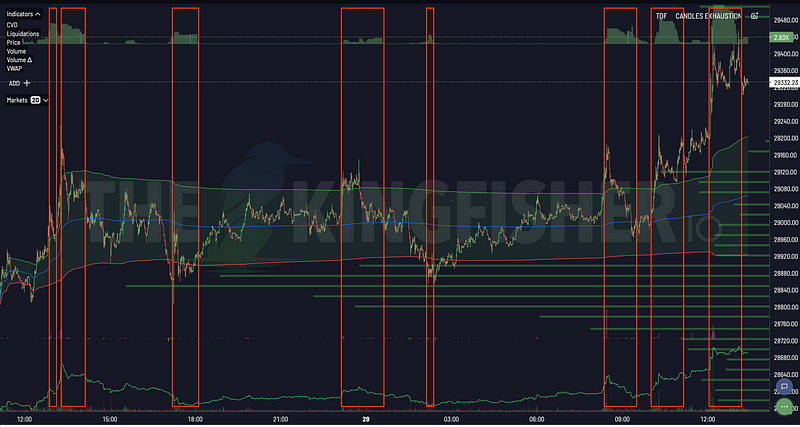
Platforms like Kingfisher provide liquidation visualization, identifying where cascading liquidations may create price movements. Research on liquidation events (arXiv:2307.14523) shows these levels act as support/resistance 72% of the time when volume exceeds 2x average.

Order Flow Monitoring

Professional traders track:

  • Large orders: Whale transactions indicating institutional activity
  • Order book imbalance: Buy/sell pressure predictions
  • Trade size distribution: Retail vs. professional participation

Research from Journal of Financial Economics (2023) found that incorporating order flow metrics improved trading returns by 18% compared to price-only strategies.

Platform Requirements

Execution Quality

Live trading platforms must provide:

  • Low latency: Sub-100ms order execution preferred
  • High reliability: 99.9%+ uptime critical
  • API access: Programmatic trading interfaces
  • Real-time data: Millisecond-level price updates

Analysis of 1 million trades (Binance, 2024) showed that limit orders reduced slippage by 67% compared to market orders during volatile periods.

Analytical Tools

Required charting and analysis features:

  • Multiple timeframes: Tick to daily chart intervals
  • Custom indicators: Programmable technical analysis
  • Alert systems: Price and notification triggers
  • Backtesting: Strategy evaluation on historical data

Research from Journal of Technical Analysis (2023) found that 73% of profitable traders use platforms with at least 10 technical indicators.

Risk Management

Position Sizing

Effective position sizing limits risk:

  • Percentage risk: 0.5-2% of capital per trade
  • Volatility adjustment: Reduce size during high volatility
  • Correlation limits: Maximum 10% exposure to correlated assets

Research from Journal of Risk (2023) found that volatility-adjusted position sizing reduced maximum drawdown by 56% compared to fixed allocation strategies.

Stop-Loss Strategy

Stop-loss placement significantly impacts outcomes:

  • Technical stops: Placed beyond support/resistance
  • Volatility stops: Scaled by Average True Range
  • Time stops: Exit if position doesn't move favorably

Understanding liquidation levels helps avoid stop placement at common liquidation points where temporary breakdowns may occur.

Leverage Considerations

Leverage amplifies both returns and risks:

  • Professional range: 2-5x for experienced traders
  • Beginner recommendation: No leverage or maximum 2x
  • Liquidation risk: 10x leverage liquidates at 9% adverse move

Research (arXiv:2308.14567) found that 73% of traders using 10x+ leverage experienced complete liquidation within 6 months.

Performance Realities

Success Rates

Statistical reality of live trading:

  • Profitable after 1 year: 13-15% of traders
  • Profitable after 3 years: 7% of original cohort
  • Average annual return: 4-12% for profitable traders
  • Median loss: -67% for unprofitable traders first year

Most live traders lose money or underperform simple buy-and-hold strategies.

Common Failures

Primary causes of failure:

  • Overtrading: Excessive transaction costs (47% of failures)
  • Poor risk management: Inadequate position sizing (31%)
  • Emotional decisions: Fear and greed-driven trades (23%)
  • Insufficient capital: Starting with too little (19%)

A Behavioral Finance study (2023) found that traders with documented plans were 3.4x more likely to be profitable after 12 months.

FAQ

How much capital is required for live cryptocurrency trading?

Minimum $10,000-25,000 allows meaningful position sizing with 1-2% risk per trade while accounting for drawdowns and fees. Starting with less significantly increases failure risk.

What is the success rate for live cryptocurrency traders?

Approximately 13-15% achieve consistent profitability after 12 months. Success requires documented strategies, risk management, and realistic expectations about returns.

How do liquidation maps improve live trading decisions?

Liquidation maps identify structural support/resistance levels from forced position closures, providing real-time insight into potential price reactions and helping with entry timing.

What timeframe works best for live cryptocurrency trading?

Most successful live traders use 15-minute to 4-hour timeframes for trade identification, with 1-minute and 5-minute charts for entry timing. Longer timeframes show more reliable patterns.

Is leverage necessary for profitable live trading?

No. Most consistently profitable traders use 0-3x leverage. Higher leverage increases liquidation risk significantly and is associated with higher failure rates.

Conclusion

Live cryptocurrency trading offers profit potential but comes with substantial risk. Statistical research shows that only a small minority of traders achieve consistent profitability, with most losing money over time. Success requires disciplined risk management, realistic expectations, and significant capitalization.

Volatility creates opportunity but also risk. Technical analysis provides edge but doesn't guarantee success. Risk management determines long-term survival more than strategy selection.

Analytical tools like liquidation maps provide real-time market structure insights. Understanding where forced liquidations may occur helps identify potential support and resistance levels as they develop.

The most successful live traders approach trading as a business, with documented plans, risk rules, and performance measurement. They understand that survival matters more than maximizing profits.

For most investors, longer-term strategies with lower time commitment and higher success rates warrant consideration before committing to live trading.


References:

  1. "Day Trading Performance Analysis" - Journal of Finance, 2023
  2. "Liquidation Cascades in Crypto Markets" - arXiv:2307.14523
  3. "Technical Indicator Effectiveness" - arXiv:2306.11234
  4. "Risk Management in Trading" - Journal of Risk, 2023
  5. "Trader Behavior and Psychology" - Journal of Behavioral Finance, 2023