You enter a trade. Price moves your way. Then it reverses without warning and hits your liquidation. The price continues in the direction you predicted. But your position is gone.
Most traders assume this is bad luck or market manipulation. It is neither.
Why Liquidations Happen in Clusters
Liquidation clusters form when many traders use similar leverage and place positions at similar price levels. These clusters create a feedback loop:
- Price approaches a cluster of liquidation points
- Traders see their liquidation prices getting closer and panic-close positions
- The cascade of forced closures fuels the move
- Positions get liquidated and become fuel for the breakout
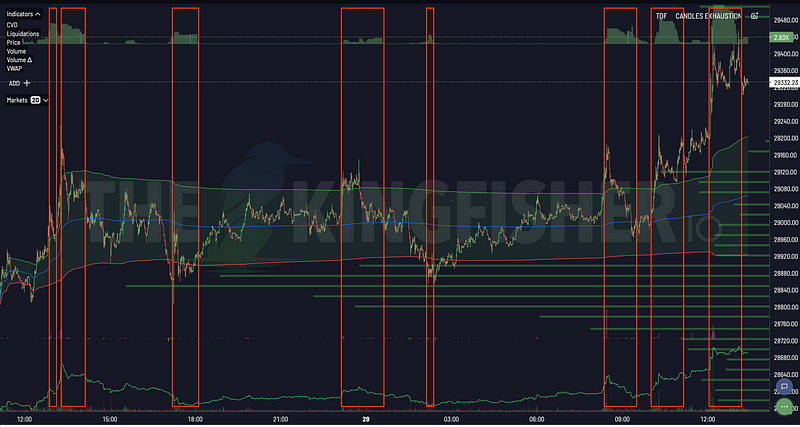
Liquidation clusters are not random. They form at specific price levels where open interest concentrates. The Kingfisher LiqMap shows you these clusters before they trigger. Explore the Ethereum liquidation map overview, then open the Kingfisher workspace for current market data. How Liquidation Heatmaps Work: LiqMap Origins, Reading Method, and Limits walks through this in more detail.
What the Liquidation Map Shows
The Liquidation Map visualizes leverage concentration across price levels:
- Clusters show where positions will be forced to close
- Bar height indicates the strength of each cluster
- Density shows how much capital is at risk at each level
- Real-time updates reflect new positions and liquidations as they happen
A Practical Workflow
Step 1: Open the Map
Go to Kingfisher's dashboard, select the asset (BTC/USDT, ETH/USDT), and pick your exchange. The map generates automatically.
Step 2: Find the Major Clusters
Look for the tallest bars. These are the high-probability target zones. Mark them on your chart. They function as more reliable support and resistance than lines drawn from price action.
Step 3: Plan Around the Clusters
- Place stop losses just beyond liquidation clusters instead of at arbitrary technical levels
- Enter positions with cluster proximity as a factor
- Set profit targets at the next major cluster
- Skip setups where your stop sits inside a large cluster
Step 4: Use the Market Imbalance Indicator
The LiqRatio shows whether long or short liquidations dominate at the current level:
- More shorts above suggests price may push up to trigger them
- More longs below suggests price may push down to trigger them
- Balanced readings suggest sideways movement
Combine With Order Flow
The LiqMap shows where price can go. Toxic Order Flow shows when informed traders are pushing price there.
Use them together:
- Find a major liquidation cluster using the LiqMap
- Check TOF to see if whales are actively pushing price toward it
- If TOF spikes at the cluster, informed traders are positioning for that move
- Position accordingly
What Changes With Visibility
Without LiqMap data:
- Stops placed at random support or resistance levels
- No way to know $500M in leveraged positions sit 2% below your entry
- Every cascade catches you off guard
- Liquidations feel like bad luck
With LiqMap data:
- Stops placed below major long clusters
- Entry timing based on cluster proximity
- Cascades visible before they trigger
- Liquidations become predictable mechanics
Who Kingfisher Is For
- Retail traders who want to stop being exit liquidity
- Institutional and portfolio managers managing large positions
- Whales tracking market impact
- Banking and risk managers monitoring leverage exposure
- Market analysts needing real-time insights
Related Articles
- Liquidation Maps: Complete Guide to Cluster Trading
- Leverage Trading Crypto: Complete Guide to Safe Leveraged Trading
- Trading Psychology Guide: Master Your Mindset for Better Trades
- Liquidation Calculator: Know Your Liq Price Before You Get Rekt
FAQ
What's the #1 cause of liquidation for new crypto traders?
Traders who choose high leverage leave less room for an adverse price move. For an isolated linear position with no extra collateral, a 5% move against 20x leverage or a 2% move against 50x leverage would exhaust the initial margin before costs. The exchange can trigger liquidation earlier because it requires maintenance margin. Traders must check the contract, mark price, maintenance tier and margin mode rather than treat those percentages as exact liquidation distances.
Can Kingfisher predict when I'm about to get liquidated?
Not "predict" in the crystal ball sense, but yes in the structural sense. The Liquidation Calculator tells you your EXACT liquidation price across all major exchanges before you enter. The LiqMap shows whether there's a massive cluster between your entry and your liq price (if yes, you're in the blast radius when that cluster triggers). GEX+ reveals whether dealers will amplify or suppress moves in your direction. TOF warns when informed flow is positioning against you. Combined, these tools tell you: "Your liq is at $62,200. There's a $600M cluster at $63,500. Dealers are suppressing upside. Whale flow is selling. You are ONE bad wick away from liquidation." That's not prediction. That's risk visibility you can act on BEFORE it happens.
What's the difference between getting stopped out and getting liquidated, and why does it matter?
You choose a stop to limit planned risk, for example 1% of account equity. Your realized loss can differ because of fees, slippage or an unfilled stop-limit order. The exchange liquidates a position or reduces account risk under its maintenance-margin rules. On Bybit, liquidation uses mark price; a stop using last traded price can trigger too late. Check the trigger reference and execution conditions in Bybit’s order-execution documentation.
Are there early warning signs that liquidation is becoming likely?
Yes, several visible on Kingfisher before the event: (1) Your position's unrealized loss approaching 40-50% of margin (you're in the danger zone regardless of where price goes next). (2) Funding cost bleeding your margin while price is flat (slowly pushing liq closer). (3) A major LiqMap cluster approaching your liq price (cascade risk, if that cluster triggers, the sweep won't stop at your liq). (4) TOF spiking aggressively against your position (informed money positioning for a move in the wrong direction). (5) GEX flipping negative in your direction (dealers will amplify the move against you). Three or more of these appearing together is the classic pre-liquidation pattern. That is the point to reassess leverage, collateral, and position size rather than wait for the exchange to close the position.
After surviving a near-liquidation experience, what should I do differently going forward?
Review your leverage, collateral, stop placement and fills before the next trade. A near-liquidation does not prove that your stop was too tight; check whether it triggered or filled. Choose position size from planned account risk and stop distance. In an isolated linear position with unchanged entry, leverage and maintenance rate, no extra margin and no tier deduction, reducing quantity alone does not change the liquidation distance because margin and exposure scale together. Extra collateral, leverage changes, maintenance tiers and cross-margin account balances can change that result. Recalculate after a position change using the relevant exchange liquidation rules.