
How to Stop Getting Liquidated Before Major Moves
The Painful Truth: You're Probably Trading Blind
Let me tell you a story that might sound painfully familiar.
You're in a trade, feeling confident. The price is moving your way, everything looks good. You're already calculating your profits.
Then suddenly—out of nowhere—it reverses. Violently.
Before you can react, your position gets liquidated. You watch helplessly as the price continues in the direction you predicted... but without you.
I've been there. It's infuriating. It's demoralizing. And it makes you question if you'll ever be a profitable trader.
But here's what took me years to figure out:
This isn't just bad luck. You're trading blind.
The brutal reality is that most traders have no idea where the massive liquidation clusters are hiding. These are the fuel zones where hundreds of millions of dollars in leveraged positions are waiting to be forcibly closed.
And when they ignite? You're the one getting burned.
The Aha! Moment: It's Not Your Fault
Here's what nobody tells you until it's too late:
The market isn't randomly hunting your stop loss. There's a systematic reason why you keep getting liquidated right before major moves.
Let me explain something that changed my entire approach to trading:
Liquidation clusters are magnetic zones. When price approaches a cluster of liquidation points, it creates a self-fulfilling prophecy:
- Traders see their liquidation prices getting closer
- Fear kicks in, they panic-close positions
- This creates the exact momentum that fuels the breakout
- You get liquidated while becoming fuel for the very move you wanted to profit from
I've watched this happen hundreds of times. It's like watching a train wreck in slow motion—until you know what to look for.
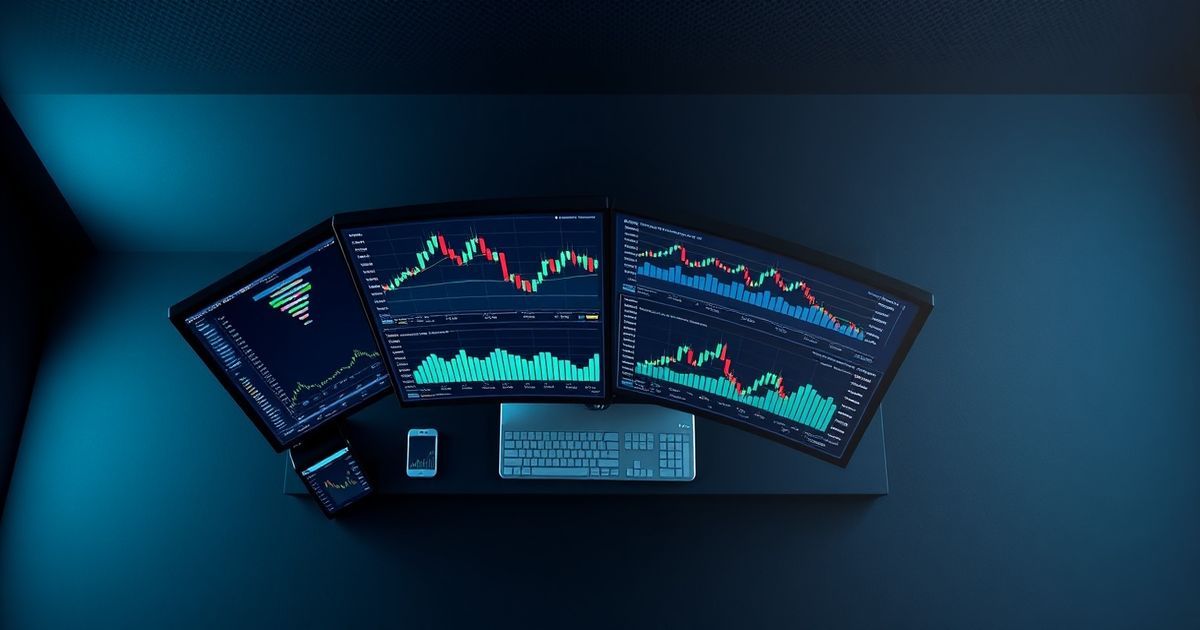
The Solution: Kingfisher's Liquidation Maps
Let me be blunt: Kingfisher's Liquidation Hunter™ Suite shows you exactly where these fuel zones are before they ignite.
It's like having X-ray vision into the market's hidden structure.
Here's what you can finally see:
- Liquidation clusters: Areas where positions will be forced to close (colors help identify different clusters)
- Bar height intensity: Taller bars = stronger liquidation effect (brightness doesn't indicate intensity)
- Cluster density: How much fuel is waiting to be released
- Real-time updates: As new positions are added or liquidated
When I first started using this, it was like someone turned on the lights in a dark room. Suddenly I could see everything.
How It Works (Without the Tech Jargon)
Look, I'm not a tech person. I'm a trader. So let me explain this in plain English:
Imagine you're looking at a battlefield map. Instead of seeing just the current positions of troops, you can see where all the landmines are buried.
The Liquidation Map is your minefield detector. It shows you:
- Where the dangerous zones are (clusters of liquidation points)
- How powerful each zone is (how much money is at risk)
- When you're getting too close to a minefield
- The safe paths around them
I wish I'd had this tool years ago. It would have saved me from countless liquidations and a whole lot of heartache.
My Step-by-Step Process: How to Use This to Stop Getting Liquidated
Step 1: Open the Liquidation Map (30 seconds)
I go to Kingfisher's dashboard, select the asset I want to trade (BTC/USDT, ETH/USDT, whatever), and choose my preferred exchange.
That's it. The map generates automatically.
Step 2: Identify the Fuel Zones (1 minute)
I look for large clusters on the map—the tall bars show strong liquidation effects.
These are my danger zones AND my profit opportunities. The bigger the cluster, the more powerful the potential move.
Pro tip: I mark these levels on my chart. They're more reliable than any support/resistance I've ever used.
Step 3: Plan Your Trade Around the Map
Instead of:
- Setting stop losses based on "support/resistance" that get hunted
- Getting surprised by violent reversals that make no sense
- Feeling like the market is personally against you
Now I can:
- Place stop losses just beyond liquidation clusters (game changer)
- Enter positions knowing exactly where the fuel zones are
- Set profit targets at the next major cluster
- Trade with confidence instead of fear
Step 4: Use the Market Imbalance Indicator
This tells me at a glance whether there are more long or short liquidations at the current price level using LiqRatios (sum of long/short liquidations on a bar).
It's my quick gut check:
- More shorts above: Price might get pushed up to trigger them
- More longs below: Price might get pushed down to trigger them
- Balanced: Higher risk of sideways movement
I use this constantly throughout the trading day.
What Changes When You Trade With Visibility
The difference between trading blind and trading with liquidation awareness isn't subtle -- it's structural:
Before LiqMap data:
- Stops placed at random support/resistance levels
- No idea $500M in leveraged positions sit 2% below your entry
- Every cascade catches you off guard
- Liquidations feel like "bad luck" or "manipulation"
After LiqMap data:
- Stops placed below major long clusters (where cascades start, not where they end)
- Entry timing based on cluster proximity (enter where fuel exists, not where it doesn't)
- You see cascades building before they trigger
- Liquidations become predictable market mechanics, not mysterious forces
This is the shift from reactive trading to proactive positioning. The clusters are there whether you can see them or not. Kingfisher lets you see them before they see you.
Advanced Strategy: The Synergy Power-Up
Want to know what I do when I really want to maximize my edge?
I combine the Liquidation Map with Toxic Order Flow for even better results:
- Find a major liquidation cluster using the Liquidation Map
- Check the Toxic Order Flow to see if whales are actively pushing price toward it
- If toxicity spikes (watch for increasing bar heights), I know informed traders are active
- Position accordingly to either avoid the trap or profit from the inevitable move
This combination is incredibly powerful. It's like having night vision goggles while everyone else is stumbling around in the dark.
Your New Trading Reality
Imagine waking up tomorrow and knowing:
- ✅ You won't get liquidated before major moves anymore
- ✅ You can see exactly where the market fuel zones are
- ✅ You can plan trades with confidence instead of fear
- ✅ You can profit from the very liquidations that used to destroy your positions
This isn't fantasy. This is what trading looks like when you have the right information.
Who Is Kingfisher For?
Kingfisher isn't just for individual traders. It's built for everyone who needs accurate crypto market data:
- Retail traders who want to stop being exit liquidity
- Institutionals and portfolio managers managing large positions
- Whales needing to track market impact
- Banking and risk managers monitoring exposure
- Market analysts and commentators needing real-time insights
- YouTubers and social media influencers sharing market analysis
- Risk analysts at trading firms
- Anyone who needs to look at crypto prices with accuracy
What Makes Kingfisher Different
Unique data you won't find anywhere else:
- Liquidation maps on ALL future symbols from major exchanges that actually move the market
- Actual alpha that makes and saves you money—not more useless data that confuses you
- Uniquely accurate information from institutional-grade sources
Available on all your devices:
- Web: Full functionality at thekingfisher.io
- Mobile: Progressive Web App (PWA) downloaded from our website—not in app stores
- Note: No offline mode, no push alerts, no biometric auth, no position management
- All data and configuration available like the desktop website
No learning curve? Not exactly. The more time and customization you put into your dashboards, the stronger they get and the better your PNL becomes.
The Bottom Line
Here's the hard truth I had to accept:
You're not a bad trader. You're just trading blind.
The liquidation clusters are there whether you can see them or not. The only question is: Will you be the one getting liquidated, or will you be the one profiting from it?
Kingfisher doesn't just show you these zones—it gives you uniquely accurate information you won't find anywhere else, with actual alpha that makes and saves you money rather than useless data that confuses you.
Related Articles
- Liquidation Maps: Complete Guide to Cluster Trading
- Leverage Trading Crypto: Complete Guide to Safe Leveraged Trading
- Trading Psychology Guide: Master Your Mindset for Better Trades
- Liquidation Calculator: Know Your Liq Price Before You Get Rekt
FAQ
Q: What's the #1 cause of liquidation for new crypto traders? A: Overleveraging combined with underestimating normal market volatility. New traders see "100x leverage available" and think it means opportunity. It means the opposite. At 20x leverage, a 5% price move (completely normal for BTC in a single day) liquidates your entire position. At 50x, a 2% wick does it. At 100x, one large candle. Meanwhile, professional perp traders live in the 2x-5x range and survive every cycle. The math is brutal but simple: each doubling of leverage halves your room for error. The traders who survive aren't the smartest ones -- they're the ones who understood this math before pressing the "leverage up" button.
Q: Can Kingfisher actually predict when I'm about to get liquidated? A: Not "predict" in the crystal ball sense, but yes in the structural sense. The Liquidation Calculator tells you your EXACT liquidation price across all major exchanges before you enter. The LiqMap shows whether there's a massive cluster between your entry and your liq price (if yes, you're in the blast radius when that cluster triggers). GEX+ reveals whether dealers will amplify or suppress moves in your direction. TOF warns when informed flow is positioning against you. Combined, these tools tell you: "Your liq is at $62,200. There's a $600M cluster at $63,500. Dealers are suppressing upside. Whale flow is selling. You are ONE bad wick away from liquidation." That's not prediction -- that's risk visibility you can act on BEFORE it happens.
Q: What's the difference between getting stopped out and getting liquidated, and why does it matter? A: Stopped out: you lose a CONTROLLED amount (your stop-loss triggers, you lose 1-2% of your account, position closes, you live to trade another day). Liquidated: the EXCHANGE force-closes your position because your margin fell below maintenance requirement. You lose EVERYTHING in that position (often 50-100% of allocated margin), potentially more if gaps occur. A stop-loss is a decision YOU made in advance. A liquidation is a decision the MARKET made for you at the worst possible moment. Every risk management rule exists to ensure you get stopped out (painful but survivable) rather than liquidated (potentially account-ending).
Q: Are there early warning signs that liquidation is becoming likely? A: Yes, several visible on Kingfisher before the event: (1) Your position's unrealized loss approaching 40-50% of margin (you're in the danger zone regardless of where price goes next). (2) Funding cost bleeding your margin while price is flat (slowly pushing liq closer). (3) A major LiqMap cluster approaching your liq price (cascade risk -- if that cluster triggers, the sweep won't stop at your liq). (4) TOF spiking aggressively against your position (informed money positioning for a move in the wrong direction). (5) GEX flipping negative in your direction (dealers will amplify the move against you). Three+ of these simultaneously = reduce size or exit immediately. Don't wait for the exchange to close you out.
Q: After surviving a near-liquidation experience, what should I do differently going forward? A: Three non-negotiable changes: (1) Reduce maximum leverage permanently. Whatever leverage got you nearly liquidated, cut it in half. If 10x almost killed you, max leverage going forward is 5x. (2) Widen your stop-loss distance. Your old stop was clearly too tight (or you wouldn't have been in liq territory). Accept smaller position sizes with wider stops over large positions with tight stops. (3) Add the Liquidation Calculator to your PRE-TRADE checklist. Run it BEFORE every leveraged trade. Know your liq price before entry. If the liq is closer than you're comfortable with, reduce position size until it pushes further away. Never enter a leveraged trade without knowing exactly where the line is.
Stop being the fuel. Start being the predator.
Get Your Edge Now – Stop Getting Liquidated → Try Free
P.S. — This is just one tool in Kingfisher's arsenal. Imagine what you could do with the full suite...
P.P.S. — I still remember the first time I saw a liquidation cluster on the map and watched price get magnetically pulled toward it. The feeling of finally understanding what was happening? Indescribable.
Want to experience that yourself? Start with a free trial or see what Kingfisher offers.
Transform Your Crypto Strategy
Harness The Power of The Kingfisher's Comprehensive Market Intelligence!
Glossary
Learn key terms and concepts from our comprehensive crypto trading glossary.
Browse Glossary →Related Articles
How to Detect Crypto Market Manipulation in Real-Time
Stop being played by whales. Learn to spot crypto manipulation before it costs you money using Kingfisher's Toxic Order Flow and liquidation data. Real examples included.

Options Skew Templates for Perp Traders: Complete Guide to Using Skew Data on Kingfisher
Master options skew data for perpetual futures trading. Learn how to read and use Skew templates on Kingfisher, understand different template types (Basic, Vanilla, Premium), when each template works best, and how to combine skew analysis with LiqMap confirmation for high-probability crypto trading setups.

Toxic Order Flow Bitcoin: Detect Market Manipulation in Real-Time
Stop being exit liquidity. Learn how toxic order flow (TOF) reveals when whales are hunting retail traders. Practical guide with step-by-step interpretation and trading strategies.

Getting Started on The Kingfisher: Stop Being Exit Liquidity
What problem does Kingfisher solve? See how liquidation maps reveal where price will go BEFORE it moves there. Stop getting hunted by whales. Start trading with an edge in 10 minutes.